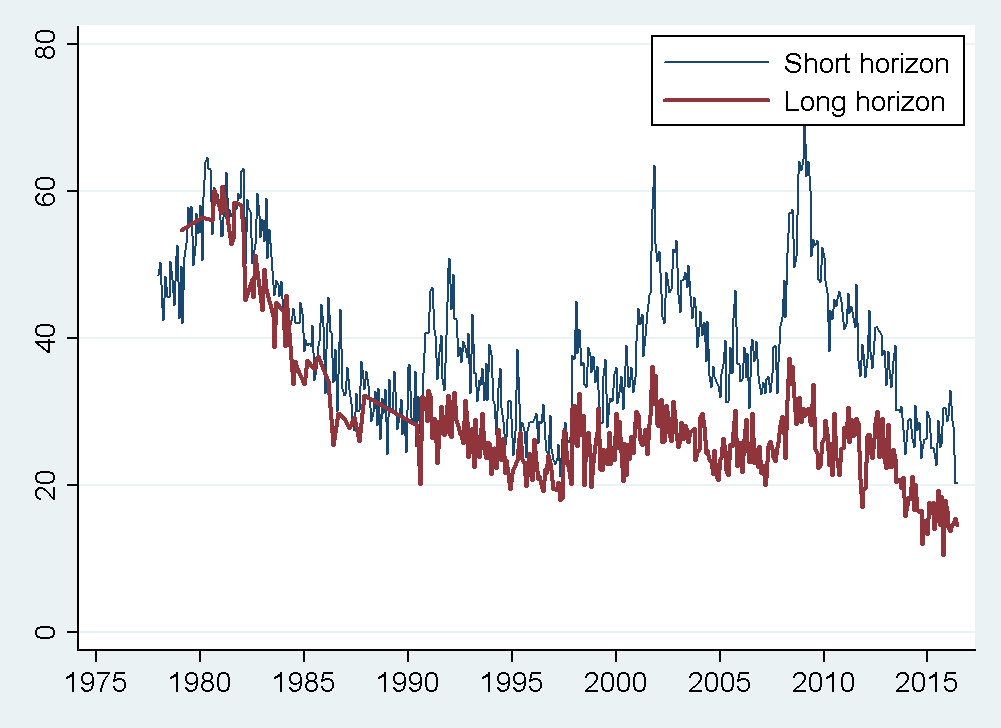
In recent months, there has been no notable change in inflation uncertainty at either horizon.
Showing posts with label inflation targeting. Show all posts
Thursday, December 7, 2017
Consumer Inflation Uncertainty Holding Steady
I recently updated my Consumer Inflation Uncertainty Index through October 2017. Data is available here and the official (gated) publication in the Journal of Monetary Economics is here. Inflation uncertainty remains low by historic standards. Uncertainty about longer-run (5- to 10-year ahead) inflation remains lower than uncertainty about next-year inflation.
The average "less uncertain" type consumer still expects longer-run inflation around 2.4%, while the longer-run inflation forecasts of "highly uncertain" consumers have risen in recent months to the 8-10% range.
Friday, October 13, 2017
Rethinking Macroeconomic Policy
I had the pleasure of attending “Rethinking Macroeconomic Policy IV” at the Peterson Institute for International Economics. I highly recommend viewing the panels and materials online.
The two-day conference left me wondering what it actually means to “rethink” macro. The conference title refers to rethinking macroeconomic policy, not macroeconomic research or analysis, but of course these are related. Adam Posen’s opening remarks expressed dissatisfaction with DSGE models, VARs, and the like, and these sentiments were occasionally echoed in the other panels in the context of the potentially large role of nonlinearities in economic dynamics. Then, in the opening session, Olivier Blanchard talked about whether we need a “revolution” or “evolution” in macroeconomic thought. He leans toward the latter, while his coauthor Larry Summers leans toward the former. But what could either of these look like? How could we replace or transform the existing modes of analysis?
I looked back on the materials from Rethinking Macroeconomic Policy of 2010. Many of the policy challenges discussed at that conference are still among the biggest challenges today. For example, low inflation and low nominal interest rates limit the scope of monetary policy in recessions. In 2010, raising the inflation target and strengthening automatic fiscal stabilizers were both suggested as possible policy solutions meriting further research and discussion. Inflation and nominal rates are still very low seven years later, and higher inflation targets and stronger automatic stabilizers are still discussed, but what I don’t see is a serious proposal for change in the way we evaluate these policy proposals.
Plenty of papers use basically standard macro models and simulations to quantify the costs and benefits of raising the inflation target. Should we care? Should we discard them and rely solely on intuition? I’d say: probably yes, and probably no. Will we (academics and think tankers) ever feel confident enough in these results to make a real policy change? Maybe, but then it might not be up to us.
Ben Bernanke raised probably the most specific and novel policy idea of the conference, a monetary policy framework that would resemble a hybrid of inflation targeting and price level targeting. In normal times, the central bank would have a 2% inflation target. At the zero lower bound, the central bank would allow inflation to rise above the 2% target until inflation over the duration of the ZLB episode averaged 2%. He suggested that this framework would have some of the benefits of a higher inflation target and of price level targeting without some of the associated costs. Inflation would average 2%, so distortions from higher inflation associated with a 4% target would be avoided. The possibly adverse credibility costs of switching to a higher target would also be minimized. The policy would provide the usual benefits of history-dependence associated with price level targeting, without the problems that this poses when there are oil shocks.
It’s an exciting idea, and intuitively really appealing to me. But how should the Fed ever decide whether or not to implement it? Bernanke mentioned that economists at the Board are working on simulations of this policy. I would guess that these simulations involve many of the assumptions and linearizations that rethinking types love to demonize. So again: Should we care? Should we rely solely on intuition and verbal reasoning? What else is there?
Later, Jason Furman presented a paper titled, “Should policymakers care whether inequality is helpful or harmful for growth?” He discussed some examples of evaluating tradeoffs between output and distribution in toy models of tax reform. He begins with the Mankiw and Weinzierl (2006) example of a 10 percent reduction in labor taxes paid for by a lump-sum tax. In a Ramsey model with a representative agent, this policy change would raise output by 1 percent. Replacing the representative agent with agents with the actual 2010 distribution of U.S. incomes, only 46 percent of households would see their after-tax income increase and 41 percent would see their welfare increase. More generally, he claims that “the growth effects of tax changes are about an order of magnitude smaller than the distributional effects of tax changes—and the disparity between the welfare and distribution effects is even larger” (14). He concludes:
As Posen then pointed out, Furman’s paper and his discussants largely ignored the discussions of macroeconomic stabilization and business cycles that dominated the previous sessions on monetary and fiscal policy. The panelists acceded that recessions, and hysteresis in unemployment, can exacerbate economic disparities. But the fact that stabilization policy was so disconnected from the initial discussion of inequality and growth shows just how much rethinking still has not occurred.
In 1987, Robert Lucas calculated that the welfare costs of business cycles are minimal. In some sense, we have “rethought” this finding. We know that it is built on assumptions of a representative agent and no hysteresis, among other things. And given the emphasis in the fiscal and monetary policy sessions on avoiding or minimizing business cycle fluctuations, clearly we believe that the costs of business cycle fluctuations are in fact quite large. I doubt many economists would agree with the statement that “the welfare costs of business cycles are minimal.” Yet, the public finance literature, even as presented at a conference on rethinking macroeconomic policy, still evaluates welfare effects of policy using models that totally omit business cycle fluctuations, because, within those models, such fluctuations hardly matter for welfare. If we believe that the models are “wrong” in their implications for the welfare effects of fluctuations, why are we willing to take their implications for the welfare effects of tax policies at face value?
I don’t have a good alternative—but if there is a Rethinking Macroeconomic Policy V, I hope some will be suggested. The fact that the conference speakers are so distinguished is both an upside and a downside. They have the greatest understanding of our current models and policies, and in many cases were central to developing them. They can rethink, because they have already thought, and moreover, they have large influence and loud platforms. But they are also quite invested in the status quo, for all they might criticize it, in a way that may prevent really radical rethinking (if it is really needed, which I’m not yet convinced of). (A more minor personal downside is that I was asked multiple times whether I was an intern.)
If there is a Rethinking Macroeconomic Policy V, I also hope that there will be a session on teaching and training. The real rethinking is going to come from the next generations of economists. How do we help them learn and benefit from the current state of economic knowledge without being constrained by it? This session could also touch on continuing education for current economists. What kinds of skills should we be trying to develop now? What interdisciplinary overtures should we be making?
The two-day conference left me wondering what it actually means to “rethink” macro. The conference title refers to rethinking macroeconomic policy, not macroeconomic research or analysis, but of course these are related. Adam Posen’s opening remarks expressed dissatisfaction with DSGE models, VARs, and the like, and these sentiments were occasionally echoed in the other panels in the context of the potentially large role of nonlinearities in economic dynamics. Then, in the opening session, Olivier Blanchard talked about whether we need a “revolution” or “evolution” in macroeconomic thought. He leans toward the latter, while his coauthor Larry Summers leans toward the former. But what could either of these look like? How could we replace or transform the existing modes of analysis?
I looked back on the materials from Rethinking Macroeconomic Policy of 2010. Many of the policy challenges discussed at that conference are still among the biggest challenges today. For example, low inflation and low nominal interest rates limit the scope of monetary policy in recessions. In 2010, raising the inflation target and strengthening automatic fiscal stabilizers were both suggested as possible policy solutions meriting further research and discussion. Inflation and nominal rates are still very low seven years later, and higher inflation targets and stronger automatic stabilizers are still discussed, but what I don’t see is a serious proposal for change in the way we evaluate these policy proposals.
Plenty of papers use basically standard macro models and simulations to quantify the costs and benefits of raising the inflation target. Should we care? Should we discard them and rely solely on intuition? I’d say: probably yes, and probably no. Will we (academics and think tankers) ever feel confident enough in these results to make a real policy change? Maybe, but then it might not be up to us.
Ben Bernanke raised probably the most specific and novel policy idea of the conference, a monetary policy framework that would resemble a hybrid of inflation targeting and price level targeting. In normal times, the central bank would have a 2% inflation target. At the zero lower bound, the central bank would allow inflation to rise above the 2% target until inflation over the duration of the ZLB episode averaged 2%. He suggested that this framework would have some of the benefits of a higher inflation target and of price level targeting without some of the associated costs. Inflation would average 2%, so distortions from higher inflation associated with a 4% target would be avoided. The possibly adverse credibility costs of switching to a higher target would also be minimized. The policy would provide the usual benefits of history-dependence associated with price level targeting, without the problems that this poses when there are oil shocks.
It’s an exciting idea, and intuitively really appealing to me. But how should the Fed ever decide whether or not to implement it? Bernanke mentioned that economists at the Board are working on simulations of this policy. I would guess that these simulations involve many of the assumptions and linearizations that rethinking types love to demonize. So again: Should we care? Should we rely solely on intuition and verbal reasoning? What else is there?
Later, Jason Furman presented a paper titled, “Should policymakers care whether inequality is helpful or harmful for growth?” He discussed some examples of evaluating tradeoffs between output and distribution in toy models of tax reform. He begins with the Mankiw and Weinzierl (2006) example of a 10 percent reduction in labor taxes paid for by a lump-sum tax. In a Ramsey model with a representative agent, this policy change would raise output by 1 percent. Replacing the representative agent with agents with the actual 2010 distribution of U.S. incomes, only 46 percent of households would see their after-tax income increase and 41 percent would see their welfare increase. More generally, he claims that “the growth effects of tax changes are about an order of magnitude smaller than the distributional effects of tax changes—and the disparity between the welfare and distribution effects is even larger” (14). He concludes:
“a welfarist analyzing tax policies that entail tradeoffs between efficiency and equity would not be far off in just looking at static distribution tables and ignoring any dynamic effects altogether. This is true for just about any social welfare function that places a greater weight on absolute gains for households at the bottom than at the top. Under such an approach policymaking could still be done under a lexicographic process—so two tax plans with the same distribution would be evaluated on the basis of whichever had higher growth rates…but in this case growth would be the last consideration, not the first” (16).
As Posen then pointed out, Furman’s paper and his discussants largely ignored the discussions of macroeconomic stabilization and business cycles that dominated the previous sessions on monetary and fiscal policy. The panelists acceded that recessions, and hysteresis in unemployment, can exacerbate economic disparities. But the fact that stabilization policy was so disconnected from the initial discussion of inequality and growth shows just how much rethinking still has not occurred.
In 1987, Robert Lucas calculated that the welfare costs of business cycles are minimal. In some sense, we have “rethought” this finding. We know that it is built on assumptions of a representative agent and no hysteresis, among other things. And given the emphasis in the fiscal and monetary policy sessions on avoiding or minimizing business cycle fluctuations, clearly we believe that the costs of business cycle fluctuations are in fact quite large. I doubt many economists would agree with the statement that “the welfare costs of business cycles are minimal.” Yet, the public finance literature, even as presented at a conference on rethinking macroeconomic policy, still evaluates welfare effects of policy using models that totally omit business cycle fluctuations, because, within those models, such fluctuations hardly matter for welfare. If we believe that the models are “wrong” in their implications for the welfare effects of fluctuations, why are we willing to take their implications for the welfare effects of tax policies at face value?
I don’t have a good alternative—but if there is a Rethinking Macroeconomic Policy V, I hope some will be suggested. The fact that the conference speakers are so distinguished is both an upside and a downside. They have the greatest understanding of our current models and policies, and in many cases were central to developing them. They can rethink, because they have already thought, and moreover, they have large influence and loud platforms. But they are also quite invested in the status quo, for all they might criticize it, in a way that may prevent really radical rethinking (if it is really needed, which I’m not yet convinced of). (A more minor personal downside is that I was asked multiple times whether I was an intern.)
If there is a Rethinking Macroeconomic Policy V, I also hope that there will be a session on teaching and training. The real rethinking is going to come from the next generations of economists. How do we help them learn and benefit from the current state of economic knowledge without being constrained by it? This session could also touch on continuing education for current economists. What kinds of skills should we be trying to develop now? What interdisciplinary overtures should we be making?
Thursday, September 28, 2017
An Inflation Expectations Experiment
Last semester, my senior thesis advisee Alex Rodrigue conducted a survey-based information experiment via Amazon Mechanical Turk. We have coauthored a working paper detailing the experiment and results titled "Household Informedness and Long-Run Inflation Expectations: Experimental Evidence." I presented our research at my department seminar yesterday with the twin babies in tow, and my tweet about the experience is by far my most popular to date:
As shown in the figure above, before receiving the treatments, very few respondents forecast 2% inflation over the long-run and only about a third even forecast in the 1-3% range. Over half report a multiple-of-5% forecast, which, as I argue in a recent paper in the Journal of Monetary Economics, is a likely sign of high uncertainty. When presented with a graph of the past 15 years of inflation, or with the FOMC statement announcing the 2% target, the average respondent revises their forecast around 2 percentage points closer to the target. Uncertainty also declines.
The results are consistent with imperfect information models because the information treatments are publicly available, yet respondents still revise their expectations after the treatments. Low informedness is part of the reason why expectations are far from the target. The results are also consistent with Bayesian updating, in the sense that high prior uncertainty is associated with larger revisions. But equally noteworthy is the fact that even after receiving both treatments, expectations are still quite heterogeneous and many still substantially depart from the target. So people seem to interpret the information in different ways and view it as imperfectly credible.
We look at how treatment effects vary by respondent characteristic. One interesting result is that, after receiving both treatments, the discrepancy between mean male and female inflation expectations (which has been noted in many studies) nearly disappears (see figure below).
There is more in the paper about how treatment effects vary with other characteristics, including respondents' opinion of government policy and their prior knowledge. We also look at whether expectations can be "un-anchored from below" with the graph treatment.
Consumers' inflation expectations are very disperse; on household surveys, many people report long-run inflation expectations that are far from the Fed's 2% target. Are these people unaware of the target, or do they know it but remain unconvinced of its credibility? In another paper in the Journal of Macroeconomics, I provide some non-experimental evidence that public knowledge of the Fed and its objectives is quite limited. In this paper, we directly treat respondents with information about the target and about past inflation, in randomized order, and see how they revise their reported long-run inflation expectations. We also collect some information about their prior knowledge of the Fed and the target, their self-reported understanding of inflation, and their numeracy and demographic characteristics. About a quarter of respondents knew the Fed's target and two-thirds could identify Yellen as Fed Chair from a list of three options.I gave a 90 minute econ seminar today with the twin babies, both awake. Held one and audience passed the other around. A first in economics?— Carola Conces Binder (@cconces) September 28, 2017
As shown in the figure above, before receiving the treatments, very few respondents forecast 2% inflation over the long-run and only about a third even forecast in the 1-3% range. Over half report a multiple-of-5% forecast, which, as I argue in a recent paper in the Journal of Monetary Economics, is a likely sign of high uncertainty. When presented with a graph of the past 15 years of inflation, or with the FOMC statement announcing the 2% target, the average respondent revises their forecast around 2 percentage points closer to the target. Uncertainty also declines.
The results are consistent with imperfect information models because the information treatments are publicly available, yet respondents still revise their expectations after the treatments. Low informedness is part of the reason why expectations are far from the target. The results are also consistent with Bayesian updating, in the sense that high prior uncertainty is associated with larger revisions. But equally noteworthy is the fact that even after receiving both treatments, expectations are still quite heterogeneous and many still substantially depart from the target. So people seem to interpret the information in different ways and view it as imperfectly credible.
We look at how treatment effects vary by respondent characteristic. One interesting result is that, after receiving both treatments, the discrepancy between mean male and female inflation expectations (which has been noted in many studies) nearly disappears (see figure below).
There is more in the paper about how treatment effects vary with other characteristics, including respondents' opinion of government policy and their prior knowledge. We also look at whether expectations can be "un-anchored from below" with the graph treatment.
Monday, August 21, 2017
New Argument for a Higher Inflation Target
On voxeu.org, Philippe Aghion, Antonin Bergeaud, Timo Boppart, Peter Klenow, and Huiyu Li discuss their recent work on the measurement of output and whether measurement bias can account for the measured slowdown in productivity growth. While the work is mostly relevant to discussions of the productivity slowdown and secular stagnation, I was interested in a corollary that ties it to discussions of the optimal level of the inflation target.
The authors note the high frequency of "creative destruction" in the US, which they define as when "products exit the market because they are eclipsed by a better product sold by a new producer." This presents a challenge for statistical offices trying to measure inflation:
The standard procedure in such cases is to assume that the quality-adjusted inflation rate is the same as for other items in the same category that the statistical office can follow over time, i.e. products that are not subject to creative destruction. However, creative destruction implies that the new products enter the market because they have a lower quality-adjusted price. Our study tries to quantify the bias that arises from relying on imputation to measure US productivity growth in cases of creative destruction.
They explain that this can lead to mismeasurement of TFP growth, which they quantify by examining changes in the share of incumbent products over time:
If the statistical office is correct to assume that the quality-adjusted inflation rate is the same for creatively destroyed products as for surviving incumbent products, then the market share of surviving incumbent products should stay constant over time. If instead the market share of these incumbent products shrinks systematically over time, then the surviving subset of products must have higher average inflation than creatively destroyed products. For a given elasticity of substitution between products, the more the market share shrinks for surviving products, the more the missing growth.
From 1983 to 2013, they estimate that "missing growth" averaged about 0.63% per year. This is substantial, but there is no clear time trend (i.e. there is not more missed growth in recent years), so it can't account for the measured productivity growth slowdown.
The authors suggest that the Fed should consider adjusting its inflation target upwards to "get closer to achieving quality-adjusted price stability." A few months ago, 22 economists including Joseph Stiglitz and Narayana Kocherlakota wrote a letter urging the Fed to consider raising its inflation target, in which they stated:
Policymakers must be willing to rigorously assess the costs and benefits of previously-accepted policy parameters in response to economic changes. One of these key parameters that should be rigorously reassessed is the very low inflation targets that have guided monetary policy in recent decades. We believe that the Fed should appoint a diverse and representative blue ribbon commission with expertise, integrity, and transparency to evaluate and expeditiously recommend a path forward on these questions.
The letter did not mention this measurement bias rationale for a higher target, but the blue ribbon commission they propose should take it into consideration.
Monday, December 5, 2016
The Future is Uncertain, but So Is the Past
In a recently-released research note, Federal Reserve Board economists Alan Detmeister, David Lebow, and Ekaterina Peneva summarize new survey results on consumers' inflation perceptions. The well-known Michigan Survey of Consumers asks consumers about their expectations of future inflation (over the next year and 5- to 10- years), but does not ask them what they believe inflation has been in recent years.
In many macroeconomic models, inflation perceptions should be nearly perfect. After all, inflation statistics are publicly available, and anyone should be able to access them. The Federal Reserve commissioned the Michigan Survey of Consumers Research Center to survey consumers about their perceptions of inflation over the past year and over the past 5- to 10-years, using analogous wording to the questions about inflation expectations. As you might guess, consumers lack perfect knowledge of inflation in the recent past. If you're like most people (which, by dent of reading an economic blog, you are probably not), you probably haven't looked up inflation statistics or read the financial news recently.
But more surprisingly, consumers seem just as uncertain about past inflation, or even more so, as about future inflation. Take a look at these histograms of inflation perceptions and expectations from the February 2016 survey data:
Compare Panel A to Panel C. Panel A shows consumers' perceptions of inflation over the past 5- to 10-years, and Panel C shows their expectations for the next 5- to 10-years. Both panels show a great deal of dispersion, or variation across consumers. But also notice the response heaping at multiples of 5%. In both panels, over 10% of respondents choose 5%, and you also see more 10% responses than either 9% or 11% responses. In a working paper, I show that this response heaping is indicative of high uncertainty. Consumers choose a 5%, 10%, 15%, etc. response to indicate high imprecision in their estimates of future inflation. So it is quite surprising that even more consumers choose the 10, 15, 20, and 25% responses for perceptions of past inflation than for expectations of future inflation.
The response heaping at multiples of 5% is also quite substantial for short-term inflation perceptions (Panel B). Without access to the underlying data, I can't tell for sure whether it is more or less prevalent than for expectations of future short-term inflation, but it is certainly noticeable.
What does this tell us? People are just as unsure about inflation in the relatively recent past as they are about inflation in the near to medium-run future. And this says something important for monetary policymakers. A goal of the Federal Reserve is to anchor medium- to long-run inflation expectations at the 2% target. With strongly-anchored expectations, we should see most expectations near 2% with low uncertainty. If people are uncertain about longer-run inflation, it could either be that they are unaware of the Fed's inflation target, or aware but unconvinced that the Fed will actually achieve its target. It is difficult to say which is the case. The former would imply that we need more public informedness about economic concepts and the Fed, while the latter would imply that the Fed needs to improve its credibility among an already-informed public. Since perceptions are about as uncertain as expectations, this lends support to the idea that people are simply uninformed about inflation-- or that memory of economic statistics is relatively poor.
In many macroeconomic models, inflation perceptions should be nearly perfect. After all, inflation statistics are publicly available, and anyone should be able to access them. The Federal Reserve commissioned the Michigan Survey of Consumers Research Center to survey consumers about their perceptions of inflation over the past year and over the past 5- to 10-years, using analogous wording to the questions about inflation expectations. As you might guess, consumers lack perfect knowledge of inflation in the recent past. If you're like most people (which, by dent of reading an economic blog, you are probably not), you probably haven't looked up inflation statistics or read the financial news recently.
But more surprisingly, consumers seem just as uncertain about past inflation, or even more so, as about future inflation. Take a look at these histograms of inflation perceptions and expectations from the February 2016 survey data:
| Source: December 5 FEDS Note |
Compare Panel A to Panel C. Panel A shows consumers' perceptions of inflation over the past 5- to 10-years, and Panel C shows their expectations for the next 5- to 10-years. Both panels show a great deal of dispersion, or variation across consumers. But also notice the response heaping at multiples of 5%. In both panels, over 10% of respondents choose 5%, and you also see more 10% responses than either 9% or 11% responses. In a working paper, I show that this response heaping is indicative of high uncertainty. Consumers choose a 5%, 10%, 15%, etc. response to indicate high imprecision in their estimates of future inflation. So it is quite surprising that even more consumers choose the 10, 15, 20, and 25% responses for perceptions of past inflation than for expectations of future inflation.
The response heaping at multiples of 5% is also quite substantial for short-term inflation perceptions (Panel B). Without access to the underlying data, I can't tell for sure whether it is more or less prevalent than for expectations of future short-term inflation, but it is certainly noticeable.
What does this tell us? People are just as unsure about inflation in the relatively recent past as they are about inflation in the near to medium-run future. And this says something important for monetary policymakers. A goal of the Federal Reserve is to anchor medium- to long-run inflation expectations at the 2% target. With strongly-anchored expectations, we should see most expectations near 2% with low uncertainty. If people are uncertain about longer-run inflation, it could either be that they are unaware of the Fed's inflation target, or aware but unconvinced that the Fed will actually achieve its target. It is difficult to say which is the case. The former would imply that we need more public informedness about economic concepts and the Fed, while the latter would imply that the Fed needs to improve its credibility among an already-informed public. Since perceptions are about as uncertain as expectations, this lends support to the idea that people are simply uninformed about inflation-- or that memory of economic statistics is relatively poor.
Tuesday, September 27, 2016
Why are Long-Run Inflation Expectations Falling?
Randal Verbrugge and I have just published a Federal Reserve Bank of Cleveland Economic Commentary called "Digging into the Downward Trend in Consumer Inflation Expectations." The piece focuses on long-run inflation expectations--expectations for the next 5 to 10 years-- from the Michigan Survey of Consumers. These expectations have been trending downward since the summer of 2014, around the same time as oil and gas prices started to decline. It might seem natural to conclude that falling gas prices are responsible for the decline in long-run inflation expectations. But we suggest that this may not be the whole story.
First of all, gas prices have exhibited two upward surges since 2014, neither of which was associated with a rise in long-run inflation expectations. Second, the correlation between gas prices and inflation expectations (a relationship I explore in much more detail in this working paper) appears too weak to explain the size of the decline. So what else could be going on?
If you look at the histogram in Figure 2, below, you can see the distribution of inflation forecasts that consumers give in three different time periods: an early period, the first half of 2014, and the past year. The shaded gray bars correspond to the early period, the red bars to 2014, and the blue bars to the most recent period. Notice that there is some degree of "response heaping" at multiples of 5%. In another paper, I use this response heaping to help quantify consumers' uncertainty about long-run inflation. The idea is that people who are more uncertain about inflation, or have a less precise estimate of what it should be, tend to report a round number-- this is a well-documented tendency in how people communicate imprecision.
The response heaping has declined over time, corresponding to a fall in my consumer inflation uncertainty index for the longer horizon. As we detail in the Commentary, this fall in uncertainty helps explain the decline in the measured median inflation forecast. This is a remnant of the fact that common round forecasts, 5% and 10%, are higher than common non-round forecasts.
There is also a notable change in the distribution of non-round forecasts over time. The biggest change is that 1% forecasts for long-run inflation are much more common than previously (see how the blue bar is higher than the red and gray bars for 1% inflation). I think this is an important sign that some consumers (probably those that are more informed about the economy and inflation) are noticing that inflation has been quite low for an extended period, and are starting to incorporate low inflation into their long-run expectations. More consumers expect 1% inflation than 2%.
First of all, gas prices have exhibited two upward surges since 2014, neither of which was associated with a rise in long-run inflation expectations. Second, the correlation between gas prices and inflation expectations (a relationship I explore in much more detail in this working paper) appears too weak to explain the size of the decline. So what else could be going on?
If you look at the histogram in Figure 2, below, you can see the distribution of inflation forecasts that consumers give in three different time periods: an early period, the first half of 2014, and the past year. The shaded gray bars correspond to the early period, the red bars to 2014, and the blue bars to the most recent period. Notice that there is some degree of "response heaping" at multiples of 5%. In another paper, I use this response heaping to help quantify consumers' uncertainty about long-run inflation. The idea is that people who are more uncertain about inflation, or have a less precise estimate of what it should be, tend to report a round number-- this is a well-documented tendency in how people communicate imprecision.
The response heaping has declined over time, corresponding to a fall in my consumer inflation uncertainty index for the longer horizon. As we detail in the Commentary, this fall in uncertainty helps explain the decline in the measured median inflation forecast. This is a remnant of the fact that common round forecasts, 5% and 10%, are higher than common non-round forecasts.
There is also a notable change in the distribution of non-round forecasts over time. The biggest change is that 1% forecasts for long-run inflation are much more common than previously (see how the blue bar is higher than the red and gray bars for 1% inflation). I think this is an important sign that some consumers (probably those that are more informed about the economy and inflation) are noticing that inflation has been quite low for an extended period, and are starting to incorporate low inflation into their long-run expectations. More consumers expect 1% inflation than 2%.
Tuesday, August 16, 2016
More Support for a Higher Inflation Target
Ever since the FOMC announcement in 2012 that 2% PCE inflation is consistent with the Fed's price stability mandate, economists have questioned whether the 2% target is optimal. In 2013, for example, Laurence Ball made the case for a 4% target. Two new NBER working papers out this week each approach the topic of the optimal inflation target from different angles. Both, I think, can be interpreted as supportive of a somewhat higher target-- or at least of the idea that moderately higher inflation has greater benefits and smaller costs than conventionally believed.
The first, by Marc Dordal-i-Carreras, Olivier Coibion, Yuriy Gorodnichenko, and Johannes Wieland, is called "Infrequent but Long-Lived Zero-Bound Episodes and the Optimal Rate of Inflation." One benefit of a higher inflation target is to reduce the occurrence of zero lower bound (ZLB) episodes, so understanding the welfare costs of these episodes is important in calculating an optimal inflation target. The authors explain that in standard models with a ZLB, normally-distributed shocks result in short-lived ZLB episodes. This is in contrast with the reality of frequent but long-lived ZLB episodes. They build models that can generate long-lived ZLB episodes and show that welfare costs of ZLB episodes increase steeply with duration; 8 successive quarters at the ZLB is costlier than two separate 4-quarter episodes.
If ZLB episodes are costlier, it makes sense to have a higher inflation target to reduce their frequency. The authors note, however, that the estimate of the optimal target implied by their models are very sensitive to modeling assumptions and calibration:
Empirical evidence of inefficient price dispersion is sparse, since there is relatively minimal fluctuation in inflation in the past few decades, when BLS microdata on consumer prices is available. Nakamura et al. undertook the arduous task of extending the BLS microdataset back to 1977, encompassing higher-inflation episodes. Calculating price dispersion within a category of goods can be problematic, because price dispersion may arise from differences in quality or features of the goods. The authors instead look at the absolute size of price changes, explaining, "Intuitively, if inflation leads prices to drift further away from their optimal level, we should see prices adjusting by larger amounts when they adjust. The absolute size of price adjustments should reveal how far away from optimal the adjusting prices had become before they were adjusted. The absolute size of price adjustment should therefore be highly informative about inefficient price dispersion."
They find that the mean absolute size of price changes is fairly constant from 1977 to the present, and conclude that "There is, thus, no evidence that prices deviated more from their optimal level during the Great Inflation period when inflation was running at higher than 10% per year than during the more recent period when inflation has been close to 2% per year. We conclude from this that the main costs of inflation in the New Keynesian model are completely elusive in the data. This implies that the strong conclusions about optimality of low inflation rates reached by researchers using models of this kind need to be reassessed."
The first, by Marc Dordal-i-Carreras, Olivier Coibion, Yuriy Gorodnichenko, and Johannes Wieland, is called "Infrequent but Long-Lived Zero-Bound Episodes and the Optimal Rate of Inflation." One benefit of a higher inflation target is to reduce the occurrence of zero lower bound (ZLB) episodes, so understanding the welfare costs of these episodes is important in calculating an optimal inflation target. The authors explain that in standard models with a ZLB, normally-distributed shocks result in short-lived ZLB episodes. This is in contrast with the reality of frequent but long-lived ZLB episodes. They build models that can generate long-lived ZLB episodes and show that welfare costs of ZLB episodes increase steeply with duration; 8 successive quarters at the ZLB is costlier than two separate 4-quarter episodes.
If ZLB episodes are costlier, it makes sense to have a higher inflation target to reduce their frequency. The authors note, however, that the estimate of the optimal target implied by their models are very sensitive to modeling assumptions and calibration:
"We find that depending on our calibration of the average duration and the unconditional frequency of ZLB episodes, the optimal inflation rate can range from 1.5% to 4%. This uncertainty stems ultimately from the paucity of historical experience with ZLB episodes, which makes pinning down these parameters with any degree of confidence very difficult. A key conclusion of the paper is therefore that much humility is called for when making recommendations about the optimal rate of inflation since this fundamental data constraint is unlikely to be relaxed anytime soon."The second paper, by Emi Nakamura, Jón Steinsson, Patrick Sun, and Daniel Villar, is called "The Elusive Costs of Inflation: Price Dispersion during the U.S. Great Inflation." This paper notes that in standard New Keynesian models with Calvo pricing, one of the main welfare costs of inflation comes from inefficient price dispersion. When inflation is high, prices get further from optimal between price resets. This distorts the allocative role of prices, as relative prices no longer accurately reflect relative costs of production. In a standard New Keynesian model, the implied cost of this reduction in production efficiency is about 10% if you move from 0% inflation to 12% inflation. This is huge-- an order of magnitude greater than the welfare costs of business cycle fluctuations in output. This is why standard models recommend a very low inflation target.
Empirical evidence of inefficient price dispersion is sparse, since there is relatively minimal fluctuation in inflation in the past few decades, when BLS microdata on consumer prices is available. Nakamura et al. undertook the arduous task of extending the BLS microdataset back to 1977, encompassing higher-inflation episodes. Calculating price dispersion within a category of goods can be problematic, because price dispersion may arise from differences in quality or features of the goods. The authors instead look at the absolute size of price changes, explaining, "Intuitively, if inflation leads prices to drift further away from their optimal level, we should see prices adjusting by larger amounts when they adjust. The absolute size of price adjustments should reveal how far away from optimal the adjusting prices had become before they were adjusted. The absolute size of price adjustment should therefore be highly informative about inefficient price dispersion."
They find that the mean absolute size of price changes is fairly constant from 1977 to the present, and conclude that "There is, thus, no evidence that prices deviated more from their optimal level during the Great Inflation period when inflation was running at higher than 10% per year than during the more recent period when inflation has been close to 2% per year. We conclude from this that the main costs of inflation in the New Keynesian model are completely elusive in the data. This implies that the strong conclusions about optimality of low inflation rates reached by researchers using models of this kind need to be reassessed."
Thursday, July 21, 2016
Inflation Uncertainty Update and Rise in Below-Target Inflation Expectations
In my working paper "Measuring Uncertainty Based on Rounding: New Method and Application to Inflation Expectations," I develop a new measure of consumers' uncertainty about future inflation. The measure is based on a well-documented tendency of people to use round numbers to convey uncertainty or imprecision across a wide variety of contexts. As I detail in the paper, a strikingly large share of respondents on the Michigan Survey of Consumers report inflation expectations that are a multiple of 5%. I exploits variation over time in the distribution of survey responses (in particular, the amount of "response heaping" around multiples of 5) to create inflation uncertainty indices for the one-year and five-to-ten-year horizons.
As new Michigan Survey data becomes available, I have been updating the indices and posting them here. I previously blogged about the update through November 2015. Now that a few more months of data are publicly available, I have updated the indices through June 2016. Figure 1, below, shows the updated indices. Figure 2 zooms in on more recent years and smooths with a moving average filter. You can see that short-horizon uncertainty has been falling since its historical high point in the Great Recession, and long-horizon uncertainty has been at an historical low.
The change in response patterns from 2015 to 2016 is quite interesting. Figure 3 shows histograms of the short-horizon inflation expectation responses given in 2015 and in the first half of 2016. The brown bars show the share of respondents in 2015 who gave each response, and the black lines show the share in 2016. For both years, heaping at multiples of 5 is apparent when you observe the spikes at 5 (but not 4 or 6) and at 10 (but not 9 or 11). However, it is less sharp than in other years when the uncertainty index was higher. But also notice that in 2016, the share of 0% and 1% responses rose and the share of 2, 3, 4, 5, and 10% responses fell relative to 2015.
Some respondents take the survey twice with a 6-month gap, so we can see how people switch their responses. Of the respondents who chose a 2% forecast in the second half of 2015 (those who were possible aware of the 2% target), 18% switched to a 0% forecast and 24% switched to a 1% forecast when they took the survey again in 2016. The rise in 1% responses seems most noteworthy to me-- are people finally starting to notice slightly-below-target inflation and incorporate it into their expectations? I think it's too early to say, but worth tracking.
As new Michigan Survey data becomes available, I have been updating the indices and posting them here. I previously blogged about the update through November 2015. Now that a few more months of data are publicly available, I have updated the indices through June 2016. Figure 1, below, shows the updated indices. Figure 2 zooms in on more recent years and smooths with a moving average filter. You can see that short-horizon uncertainty has been falling since its historical high point in the Great Recession, and long-horizon uncertainty has been at an historical low.
![]() |
| Figure 1: Consumer inflation uncertainty index developed in Binder (2015) using data from the University of Michigan Survey of Consumers. To download updated data, visit https://sites.google.com/site/inflationuncertainty/. |
![]() |
| Figure 2: Consumer inflation uncertainty index (centered 3-month moving average) developed in Binder (2015) using data from the University of Michigan Survey of Consumers. To download updated data, visit https://sites.google.com/site/inflationuncertainty/. |
The change in response patterns from 2015 to 2016 is quite interesting. Figure 3 shows histograms of the short-horizon inflation expectation responses given in 2015 and in the first half of 2016. The brown bars show the share of respondents in 2015 who gave each response, and the black lines show the share in 2016. For both years, heaping at multiples of 5 is apparent when you observe the spikes at 5 (but not 4 or 6) and at 10 (but not 9 or 11). However, it is less sharp than in other years when the uncertainty index was higher. But also notice that in 2016, the share of 0% and 1% responses rose and the share of 2, 3, 4, 5, and 10% responses fell relative to 2015.
Some respondents take the survey twice with a 6-month gap, so we can see how people switch their responses. Of the respondents who chose a 2% forecast in the second half of 2015 (those who were possible aware of the 2% target), 18% switched to a 0% forecast and 24% switched to a 1% forecast when they took the survey again in 2016. The rise in 1% responses seems most noteworthy to me-- are people finally starting to notice slightly-below-target inflation and incorporate it into their expectations? I think it's too early to say, but worth tracking.
![]() |
| Figure 3: Created by Binder with data from University of Michigan Survey of Consumers |
Wednesday, January 27, 2016
Downside Inflation Risk
Earlier this month, New York Federal Reserve President William Dudley gave a speech on "The U.S. Economic Outlook and Implications for Monetary Policy." Like other Fed officials, Dudley expressed concern about falling inflation expectations:
The 22 basis-points decline in 3-year inflation expectations that Dudley referred to is the median for all consumers. If you look at the table below, the decline is more than twice as large for consumers with income above $50,000 per year.
This might be important since high-income consumers' expectations appear to be a stronger driver of actual inflation dynamics than the median consumer's expectations, probably because they are a better proxy for price-setters' expectations. These higher-income consumers' inflation expectations were at or above 3% from the start of the survey in 2013 through mid-2014, and are now at their lowest recorded level. Lower-income consumers' expectations have risen slightly from a low of 2.72% in September 2015. We need a few more months of data to separate trend from noise, but if anything this should strengthen Dudley's concern about downside risks to inflation.
With respect to the risks to the inflation outlook, the most concerning is the possibility that inflation expectations become unanchored to the downside. This would be problematic were it to occur because inflation expectations are an important driver of actual inflation. If inflation expectations become unanchored to the downside, it would become much more difficult to push inflation back up to the central bank’s objective.Dudley, perhaps because of his New York Fed affiliation, pointed to the New York Fed’s Survey of Consumer Expectations as his preferred indicator of inflation expectations. He noted that on this survey, "The median of 3-year inflation expectations has declined over the past year, falling by 22 basis points to 2.8 percent. While the magnitude of this decline is small, I think it is noteworthy because the current reading is below where we have been during the survey history."
The 22 basis-points decline in 3-year inflation expectations that Dudley referred to is the median for all consumers. If you look at the table below, the decline is more than twice as large for consumers with income above $50,000 per year.
| Source: Data from Survey of Consumer Expectations, © 2013-2015 Federal Reserve Bank of New York (FRBNY). Calculations by Carola Binder. |
Sunday, January 10, 2016
Household Inflation Uncertainty Update
In my job market paper last year, I constructed a new measure of households' inflation uncertainty based on people's tendency to use round numbers when they report their inflation expectations on the Michigan Survey of Consumers. The monthly consumer inflation uncertainty index is available at a short horizon (one-year-ahead) and a long horizon (five-to-ten-years ahead). I explain the construction of the indices in more detail, and update them periodically, at the Inflation Uncertainty website, where you can also download the indices.
I recently updated the indices through November 2015. As the figure below shows, short-horizon inflation uncertainty reached a historical maximum in February 2009, but has since fallen and remained relatively steady in the last two years. Consumers are less uncertain about longer-run than shorter- run inflation since around 1990. This makes sense if at least some consumers have anchored expectations, i.e. they are fairly certain about what will happen with inflation over the longer run, even if they expect it to fluctuate in the shorter run.

In my paper, I interpreted the decline of long-run consumer inflation uncertainty over the 1980s as a result of improved anchoring during and following the Volcker disinflation, but noted the apparent lack of improvement since the mid-90s, despite the Fed's efforts to improve its communication strategy and better anchor expectations. With an extra year of data, it looks like long-run inflation uncertainty may have actually declined, if only slightly, in the last few years. Still, that doesn't mean that consumers' expectations are strongly anchored, as I show in another working paper (which Kumar et al. follow up for New Zealand with similar results).
I recently updated the indices through November 2015. As the figure below shows, short-horizon inflation uncertainty reached a historical maximum in February 2009, but has since fallen and remained relatively steady in the last two years. Consumers are less uncertain about longer-run than shorter- run inflation since around 1990. This makes sense if at least some consumers have anchored expectations, i.e. they are fairly certain about what will happen with inflation over the longer run, even if they expect it to fluctuate in the shorter run.

In my paper, I interpreted the decline of long-run consumer inflation uncertainty over the 1980s as a result of improved anchoring during and following the Volcker disinflation, but noted the apparent lack of improvement since the mid-90s, despite the Fed's efforts to improve its communication strategy and better anchor expectations. With an extra year of data, it looks like long-run inflation uncertainty may have actually declined, if only slightly, in the last few years. Still, that doesn't mean that consumers' expectations are strongly anchored, as I show in another working paper (which Kumar et al. follow up for New Zealand with similar results).
Sunday, September 6, 2015
Which Measure of Inflation Should a Central Bank Target?
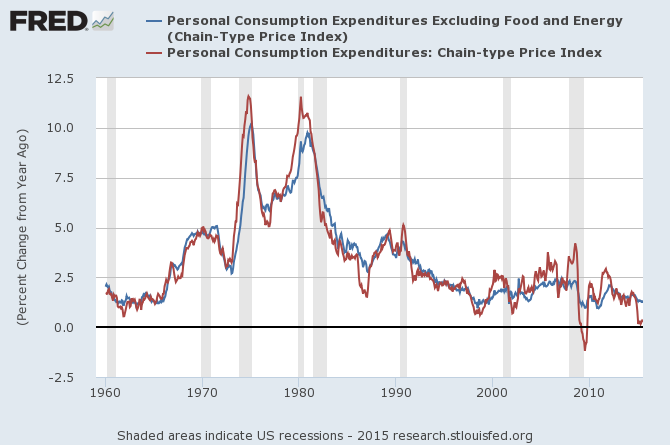
"Various monetary proposals can be viewed as inflation targeting with a nonstandard price index: The gold standard uses only the price of gold, and a fixed exchange rate uses only the price of a foreign currency."That's from a 2003 paper by Greg Mankiw and Ricardo Reis called "What Measure of Inflation Should a Central Bank Target?" At the time, the Federal Reserve had not explicitly announced its inflation target, though an emphasis on core inflation, which excludes volatile food and energy prices (the blue line in the figure below), arose under Alan Greenspan's chairmanship. Other central banks, including the Bank of England and the European Central Bank, instead focus on headline inflation. In 2012, the Fed formalized PCE inflation as its price stability target, but closely monitors core inflation as a key indicator of underlying inflation trends.. Some at the Fed, including St. Louis Fed President James Bullard, have argued that the Fed should focus more on headline inflation (the red line) and less on core inflation (the blue line).
![]() |
| Source: FRED |
In particular, they suppose the central bank's objective is to minimize the volatility of the output gap. They explain, "We are interested in finding the price index that, if kept on an assigned target, would lead to the greatest stability in economic activity. This concept might be called the stability price index." They model how the weight on each sector in this stability price index depend on certain sectoral properties: the cyclical sensitivity of the sector, the proclivity of the sector to experience idiosyncratic shocks, and the speed with which the prices in the sector can adjust.
The findings are mostly intuitive. If a particular sector's prices are very procyclical, do not experience large idiosyncratic shocks, or are very sticky, that sector should receive relatively large weight in the stability price index. Each of these characteristics makes the sector more useful from a signal-extraction perspective as an indicator of economic activity.
Next, Mankiw and Reis do a "back-of-the-envelop" exercise to calculate the weights for a stability price index for the United States using data from 1957 to 2001. They consider four sectors: food, energy, other goods and services, and nominal wages. They stick to four sectors for simplicity, but it would also be possible to include other prices, like gold and other asset prices. To the extent that these are relatively flexible and volatile, they would probably receive little weight. The inclusion of nominal wages is interesting, because it is a price of labor, not of a consumption good, so it gets a weight of 0 in the consumer price index. But nominal wages are procyclical, not prone to indiosyncratic shocks, and sticky, so the result is that the stability price index weight on nominal wages is near one, while the other sectors get weights near zero. This finding is in line with other results, even derived from very different models, about the optimality of including nominal wages in the monetary policy target.
More recently, Josh Bivens and others have proposed nominal wage targets for monetary policy, but they frame this as an alternative to unemployment as an indicator of labor market slack for the full employment component of the Fed's mandate. In Mankiw and Reis' paper, even a strict inflation targeting central bank with no full employment goal may want to use nominal wages as a big part of its preferred measure of inflation. (Since productivity
If we leave nominal wages out of the picture, the results provide some justification for a focus on core, rather than headline, inflation. Namely, food and energy prices are very volatile and not very sticky. Note, however, that the paper assumes that the central bank has perfect credibility, and can thus achieve whatever inflation target it commits to. In Bullard's argument against a focus on core inflation, he implicitly challenges this assumption:
"One immediate benefit of dropping the emphasis on core inflation would be to reconnect the Fed with households and businesses who know price changes when they see them. With trips to the gas station and the grocery store being some of the most frequent shopping experiences for many Americans, it is hardly helpful for Fed credibility to appear to exclude all those prices from consideration in the formation of monetary policy."Bullard's concern is that since food and energy prices are so visible and salient for consumers, they might play an oversized role in perceptions and expectations of inflation. If the Fed holds core inflation steady while gas prices and headline inflation rise, maybe inflation expectations will rise a lot, becoming unanchored, and causing feedback into core inflation. There is mixed evidence on whether this is a real concern in recent years. I'm doing some work on this topic myself, and hope to share results soon.
As an aside to my students in Senior Research Seminar, I highly recommend the Mankiw and Reis paper as an example of how to write well, especially if you plan to do a theoretical thesis.
Note: The description of the Federal Reserve's inflation target in the first paragraph of this post was edited for accuracy on September 25.
Monday, January 12, 2015
Targeting from Below
Inflation targeting (IT) was widely adopted by central banks in both industrialized and emerging-market countries in the 1990s and 2000s. Typically, the objective for switching to an IT framework has been to reduce and stabilize high and volatile inflation. Studies of IT find that it has been successful in regards to this objective.
But how does IT fare when inflation is instead too low? Michael Ehrmann of the Bank of Canada addresses this question in "Targeting Inflation from Below: How do Inflation Expectations Behave?" He notes that the Bank of Japan adopted IT in an environment of undesirably-low inflation. Likewise, when the Federal Reserve announced a 2% inflation target in 2012, core inflation had been below 2% for some time. "Although designed to lower inflation and inflation expectations," Ehrmann writes, "IT is now charged with the objective to raise them, a challenge that has not yet been studied extensively."
Since inflation targeting is supposed to work by anchoring expectations near the target, Ehrmann studies the inflation expectations of professional forecasters to compare the performance of IT when inflation is persistently low, near target, and persistently high. He uses data from Consensus Economics for Australia, Canada, the euro area, France, Germany, Italy, Japan, the Netherlands, New Zealand, Norway, Spain, Sweden, Switzerland, the United Kingdom and the United States. He uses three different indicators of the extent to which inflation expectations are anchored: (1) the extent to which expectations depend on lagged inflation; (2) forecaster disagreement; and (3) the extent to which inflation expectations get revised in response to news. On all three counts, he finds that under persistently low inflation, expectations can become disanchored. That is, inflation expectations are more dependent on lagged inflation; forecasters disagree more; and inflation expectations get revised down in response to lower-than-expected inflation. He also finds that when inflation is persistently low, expectations do not get revised upward in response to higher-than-expected inflation.
These findings are important. We tend to worry about inflation expectations becoming disanchored when inflation goes too high above target or stays above target for too long. This is partly why the inflation target gets treated more like a ceiling than a symmetric target. But in the current situation in the U.S. and Europe, it may be that keeping inflation too low is weakening the anchoring of expectations. A temporary burst of above-target inflation seems unlikely to damage the anchor.
But how does IT fare when inflation is instead too low? Michael Ehrmann of the Bank of Canada addresses this question in "Targeting Inflation from Below: How do Inflation Expectations Behave?" He notes that the Bank of Japan adopted IT in an environment of undesirably-low inflation. Likewise, when the Federal Reserve announced a 2% inflation target in 2012, core inflation had been below 2% for some time. "Although designed to lower inflation and inflation expectations," Ehrmann writes, "IT is now charged with the objective to raise them, a challenge that has not yet been studied extensively."
Since inflation targeting is supposed to work by anchoring expectations near the target, Ehrmann studies the inflation expectations of professional forecasters to compare the performance of IT when inflation is persistently low, near target, and persistently high. He uses data from Consensus Economics for Australia, Canada, the euro area, France, Germany, Italy, Japan, the Netherlands, New Zealand, Norway, Spain, Sweden, Switzerland, the United Kingdom and the United States. He uses three different indicators of the extent to which inflation expectations are anchored: (1) the extent to which expectations depend on lagged inflation; (2) forecaster disagreement; and (3) the extent to which inflation expectations get revised in response to news. On all three counts, he finds that under persistently low inflation, expectations can become disanchored. That is, inflation expectations are more dependent on lagged inflation; forecasters disagree more; and inflation expectations get revised down in response to lower-than-expected inflation. He also finds that when inflation is persistently low, expectations do not get revised upward in response to higher-than-expected inflation.
These findings are important. We tend to worry about inflation expectations becoming disanchored when inflation goes too high above target or stays above target for too long. This is partly why the inflation target gets treated more like a ceiling than a symmetric target. But in the current situation in the U.S. and Europe, it may be that keeping inflation too low is weakening the anchoring of expectations. A temporary burst of above-target inflation seems unlikely to damage the anchor.
Wednesday, October 1, 2014
The Brazilian Election and Central Bank Independence
From my post at the Berkeley Center for Latin American Studies (CLAS) blog:
Brazilians will head to the polls on October 5 to vote in a tight presidential race. President Dilma Rousseff’s leading challenger is Socialist Party candidate Marina Silva. A key component of Silva’s economic platform is her support for a more independent central bank. Central bank independence, long a topic of interest to economists, is now capturing wide public attention — and for good reason...You can read the rest at the CLAS blog. There is also a lot of interesting material there about the economics, culture, and politics of Latin America. For example, there's a video of a recent CLAS seminar by Professor João Saboia on "Macroeconomics, the Labor Market, and Income Distribution in Brazil." I wrote an article on his lecture that will appear in a forthcoming issue of the Berkeley Review of Latin American Studies. Since CLAS is a collaboration between professors and graduate students in many different departments at Berkeley, there is a great mix of material there on cinema, literature, the environment, policy, etc.
Friday, September 26, 2014
Targeting Two
In the Washington Post, Jared Bernstein asks why the Fed's inflation target is 2 percent. "The fact is that the target is 2 percent because the target is 2 percent," he writes. Bernstein refers to a paper by Laurence Ball suggesting that a 4% target could be preferable by reducing the likelihood of the economy running up against the zero lower bound on nominal interest rates.
Paul Krugman chimes in, adding that a 2 percent target:
Dean Baker also has a post in which he explains that Krugman's discussion of the 2 percent target "argues that it is a pretty much arbitrary compromise between the idea that the target should be zero (the dollar keeps its value constant forever) and the idea that we need some inflation to keep the economy operating smoothly and avoid the zero lower bound for interest rates. This is far too generous... Not only is there not much justification for 2.0 percent, there is not much justification for any target."
I'll add three papers, in reverse chronological order, that should be relevant to this discussion. Yuriy Gorodnichenko, Olivier Coibion, and Johannes Wieland have a 2010 paper called, "The Optimal Inflation Rate in New Keynesian Models: Should Central Banks Raise their Inflation Targets in Light of the ZLB?" They say the answer is probably no:
Another paper, which I would guess influenced some people at the Fed, is by George Akerlof, William Dickens, and George Perry in 2000. They build a model in which some agents in the economy are "near rational" instead of fully rational in the way they think about inflation:
"when inflation is low it is not especially salient, and wage and price setting will respond less than proportionally to expected inflation. At sufficiently high rates of inflation, by contrast, anticipating inflation becomes important and wage and price setting responds fully to expected inflation."
As a result, there is some moderate positive level of inflation that is optimal for employment. They estimate that this optimal rate of inflation is between 1.6 and 3.2 percent.
The first few sections of the Akerlof et al. paper are interesting in that they discuss how psychologists and economists have different approaches to the way they think about people's decisionmaking. The model in the paper tries to take a more realistic, but still relatively simple, approach to how people make decisions based on their inflation expectations. I wouldn't be surprised if this paper influenced the adoption of the 2% target.
And then, of course, is John Taylor's 1993 paper, "Discretion versus Policy Rules in Practice." Just about everyone at the Fed must have read it at some point. Here's his original Taylor rule from page 202:
If GDP is at target, the rule suggests raising the federal funds rate if inflation is above 2 percent and lowering it if inflation is less than 2 percent. He calls 2 percent the Fed's implicit target. Later he writes that "Given biases...in measuring prices, the 2-percent per year implicit inflation target rate is probably very close to price stability or zero inflation" (p. 210). This is probably where Krugman gets his argument that 2 percent "was low enough that the price stability types could be persuaded, or were willing to concede as a possibility, that true inflation — taking account of quality changes — was really zero." More importantly, this paper probably helped propagate the idea that the Fed has had an implicit 2 percent inflation target since at least the early 1990s. So when deciding on an explicit target in 2012, 2 percent seemed a natural choice.
Paul Krugman chimes in, adding that a 2 percent target:
"was low enough that the price stability types could be persuaded, or were willing to concede as a possibility, that true inflation — taking account of quality changes — was really zero. Meanwhile, as of the mid 1990s modeling efforts suggested that 2 percent was enough to make sustained periods at the zero lower bound unlikely and to lubricate the labor market sufficiently that downward wage stickiness would have minor effects. So 2 percent it was, and this rough guess acquired force as a focal point, a respectable place that wouldn’t get you in trouble.
The problem is that we now know that both the zero lower bound and wage stickiness are much bigger issues than anyone realized in the 1990s."Krugman calls the target "the terrible two," and laments that "Unfortunately, it’s now very hard to change the target; anything above 2 isn’t considered respectable."
Dean Baker also has a post in which he explains that Krugman's discussion of the 2 percent target "argues that it is a pretty much arbitrary compromise between the idea that the target should be zero (the dollar keeps its value constant forever) and the idea that we need some inflation to keep the economy operating smoothly and avoid the zero lower bound for interest rates. This is far too generous... Not only is there not much justification for 2.0 percent, there is not much justification for any target."
I'll add three papers, in reverse chronological order, that should be relevant to this discussion. Yuriy Gorodnichenko, Olivier Coibion, and Johannes Wieland have a 2010 paper called, "The Optimal Inflation Rate in New Keynesian Models: Should Central Banks Raise their Inflation Targets in Light of the ZLB?" They say the answer is probably no:
The optimal inflation rate implied by the model is 1.2% per year which is within, but near the bottom, of the range of implicit inflation targets used by central banks in industrialized countries of 1-3% per year. In addition, the welfare loss from higher inflation rates is non-trivial: raising the target rate from 1.2% to 4% per year is equivalent to permanently reducing consumption by nearly 2%. In short, using a calibrated model of the U.S. economy which balances the costs of inflation arising from infrequent adjustment of prices against the benefit of reducing the frequency of hitting the ZLB yields an optimal inflation target which is certainly no higher than what is currently in use by central banks.Their model balances the costs of inflation that arise from infrequent price adjustment against the benefit of reducing the frequency of hitting the zero lower bound. In the model, at 0 percent inflation, the zero lower bound would be binding 15 percent of the time, while at 3.5 percent inflation, the bound would bind 4 percent of the time, but the costs from price stickiness would be high. They compute that welfare would be maximized at 1.2 percent inflation.
Another paper, which I would guess influenced some people at the Fed, is by George Akerlof, William Dickens, and George Perry in 2000. They build a model in which some agents in the economy are "near rational" instead of fully rational in the way they think about inflation:
"when inflation is low it is not especially salient, and wage and price setting will respond less than proportionally to expected inflation. At sufficiently high rates of inflation, by contrast, anticipating inflation becomes important and wage and price setting responds fully to expected inflation."
As a result, there is some moderate positive level of inflation that is optimal for employment. They estimate that this optimal rate of inflation is between 1.6 and 3.2 percent.
The first few sections of the Akerlof et al. paper are interesting in that they discuss how psychologists and economists have different approaches to the way they think about people's decisionmaking. The model in the paper tries to take a more realistic, but still relatively simple, approach to how people make decisions based on their inflation expectations. I wouldn't be surprised if this paper influenced the adoption of the 2% target.
And then, of course, is John Taylor's 1993 paper, "Discretion versus Policy Rules in Practice." Just about everyone at the Fed must have read it at some point. Here's his original Taylor rule from page 202:
If GDP is at target, the rule suggests raising the federal funds rate if inflation is above 2 percent and lowering it if inflation is less than 2 percent. He calls 2 percent the Fed's implicit target. Later he writes that "Given biases...in measuring prices, the 2-percent per year implicit inflation target rate is probably very close to price stability or zero inflation" (p. 210). This is probably where Krugman gets his argument that 2 percent "was low enough that the price stability types could be persuaded, or were willing to concede as a possibility, that true inflation — taking account of quality changes — was really zero." More importantly, this paper probably helped propagate the idea that the Fed has had an implicit 2 percent inflation target since at least the early 1990s. So when deciding on an explicit target in 2012, 2 percent seemed a natural choice.
Saturday, July 19, 2014
The Most Transparent Central Bank in the World?
At a hearing before the House Financial Services Committee on Wednesday, Federal Reserve Chair Janet Yellen called the Fed the "the most transparent central bank to my knowledge in the world.” I'll try to evaluate her claim in this post. For context, the hearing focused on legislation proposed by House Republicans called the Federal Reserve Accountability and Transparency Act, which would require the Fed to choose and disclose a rule for making policy decisions. Alan Blinder explains:
What about Yellen's description of the Fed as the most transparent central bank in the world? Is it reasonable? Nergiz Dincer and Barry Eichengreen have constructed an index of transparency for more than 100 central banks. Updates to the index, released earlier this year, cover the years 1998 to 2010.
Dincer and Eichengreen rate transparency on a scale of 0 (lowest) to 15 (highest). The 15-point transparency scale is based on awarding up to 3 points in each of the following components:
The Federal Reserve, with a transparency score of 11, is tied for 7th with the ECB, the Bank of Canada, and the Reserve Bank of Australia. In 1998, the Fed's score was 8.5, and has held steady at 11 since 2006. So it is certainly reasonable to say that the Fed is among the most transparent central banks in the world. And since we can interpret transparency subjectively, and any rating scale has some degree of arbitrariness, these ratings don't disprove Yellen's claim.
The ratings were made in 2010. The Fed earned 1 out of 3 points in the political transparency category, 2.5 of 3 in procedural transparency, 1.5 of 3 in operational transparency, and perfect scores in the other categories. The Fed's score should improve at the next update, since the January 2012 announcement of a quantitative 2% inflation goal may restore some partial credit in the political transparency category. A perfect 15 is not necessarily desirable. For example, one point in the political transparency category can only be awarded if the bank has either a single explicit objective or explicitly ranks its objectives in order or priority. Most banks that earn that point explicitly target inflation. To earn that point, the Fed would have to formally declare its price stability mandate a higher priority than its maximum employment mandate (or vice versa, which seems highly unlikely), while the Congressional mandate in the Federal Reserve Act does not prioritize one over the other.
"A 'rule' in this context means a precise set of instructions—often a mathematical formula—that tells the Fed how to set monetary policy. Strictly speaking, with such a rule in place, you don't need a committee to make decisions—or even a human being. A handheld calculator will do."Blinder, who has long advocated central bank transparency, calls FRAT an "unneccessary fix" for the Fed. Discretion by an independent Fed needs not impede or preclude transparency, and the imposition of rules-based policy would not guarantee improved accountability and transparency.
What about Yellen's description of the Fed as the most transparent central bank in the world? Is it reasonable? Nergiz Dincer and Barry Eichengreen have constructed an index of transparency for more than 100 central banks. Updates to the index, released earlier this year, cover the years 1998 to 2010.
Dincer and Eichengreen rate transparency on a scale of 0 (lowest) to 15 (highest). The 15-point transparency scale is based on awarding up to 3 points in each of the following components:
- Political transparency: statement of objectives and prioritization, quantification of primary objective, and explicit contracts between monetary authority and government
- Economic transparency: publication of central bank data, models, and forecasts
- Procedural transparency: use of an explicit policy rule or strategy, and transparency over the decision-making process and deliberations
- Policy transparency: prompt announcement and explanations of decisions and intentions;
- Operational transparency: regular evaluation of the extent to which targets have been achieved, provision of information on disturbances that affect monetary policy transmission, and evaluation of policy outcomes
The Federal Reserve, with a transparency score of 11, is tied for 7th with the ECB, the Bank of Canada, and the Reserve Bank of Australia. In 1998, the Fed's score was 8.5, and has held steady at 11 since 2006. So it is certainly reasonable to say that the Fed is among the most transparent central banks in the world. And since we can interpret transparency subjectively, and any rating scale has some degree of arbitrariness, these ratings don't disprove Yellen's claim.
The ratings were made in 2010. The Fed earned 1 out of 3 points in the political transparency category, 2.5 of 3 in procedural transparency, 1.5 of 3 in operational transparency, and perfect scores in the other categories. The Fed's score should improve at the next update, since the January 2012 announcement of a quantitative 2% inflation goal may restore some partial credit in the political transparency category. A perfect 15 is not necessarily desirable. For example, one point in the political transparency category can only be awarded if the bank has either a single explicit objective or explicitly ranks its objectives in order or priority. Most banks that earn that point explicitly target inflation. To earn that point, the Fed would have to formally declare its price stability mandate a higher priority than its maximum employment mandate (or vice versa, which seems highly unlikely), while the Congressional mandate in the Federal Reserve Act does not prioritize one over the other.
Tuesday, July 8, 2014
The Unemployment Cost of Below-Target Inflation
Recently, inflation in the United States has been consistently below its 2% target. The situation in Sweden is similar, but has lasted much longer. The Swedish Riksbank announced a 2% CPI inflation target in 1993, to apply beginning in 1995. By 1997, the target was credible in the sense that inflation expectations were consistently in line with the target. From 1997 to 2011, however, CPI inflation only averaged 1.4%. In a forthcoming paper in the AEJ: Macroeconomics, Lars Svensson uses the Swedish case to estimate the possible unemployment cost of inflation below a credible target.
Svensson notes that inflation expectations that are statistically and economically higher than inflation for many years do not pass standard tests of rationality. He builds upon the "near-rational" expectations framework of Akerlof, Dickens, and Perry (2000). In Akerlof et al.'s model, when inflation is fairly close to zero, a fraction of people simply neglect inflation, and behave as if inflation were zero. This is not too unreasonable--it saves them the computational trouble of thinking about inflation and isn't too costly if inflation is really low. Thus, at low rates of inflation, prices and wages are consistently lower relative to nominal aggregate demand than they would be at zero inflation, permitting sustained higher output and employment. At higher levels of inflation, fewer people neglect it. This gives the Phillips Curve has a "hump shape"; unemployment is non-monotonic in inflation but is minimized at some low level of inflation.
In the case of Sweden, the near-rational model is modified because people are not behaving as if inflation were zero, but rather as if it were 2%, when in fact it is lower than 2%. Instead of permitting higher output and employment, the reverse happens. The figure below shows Svensson's interpretation of the Swedish economy's location on its hypothetical modified long-run Phillips curve. The encircled section is where Sweden has been for over a decade, with inflation mostly below 2% and unemployment high. If inflation were to increase above 2%, unemployment would actually decline, because people would still behave as if it were 2%. But there is a limit. If inflation gets too high (beyond about 4% in the figure), people no longer behave as if inflation were 2%, and the inflation-unemployment tradeoff changes sign.
As Svensson explains,
The figure below shows the empirical inflation-unemployment relationship in Sweden from 1976 to 2012. The long-run Phillips curve was approximately vertical in the 1970s and 80s. The observations on the far right are the economic crisis of the early 1990s. The points in red are the inflation targeting regime. The downward-sloping black line is the estimated long-run Phillips curve for this regime with average inflation below the credible target. You can see two black dots on the line, at 2% inflation and at 1.4% inflation (the average over the period). The distance between the dots on the unemployment axis is the "excess unemployment" that has resulted from maintaining inflation below target. The unemployment rate would be about 0.8% lower if inflation averaged 2% (and presumable lower still if inflation averaged slightly above 2%).
Can this analysis be applied the the United States? Even though the U.S. has only had an official 2% target since January 2012, Fuhrer (2011) notes that inflation expectations have been stabilized around 2% since 2000, since the Fed was presumed to have an implicit 2% target. The figure below plots unemployment and core CPI inflation in the U.S. from 1970 to 2012, with 2000 and later in red. Like in Sweden, the long-run Phillips curve is downward-sloping in the (implicit) inflation-targeting period. Since 2000, however, average U.S. inflation was 2%, so overall there was no unemployment cost of sustained below-target inflation. The downward slope, though, means that if we get into a situation like Sweden's where we consistently undershoot 2%, which could result if the target is treated more like a ceiling than a symmetric target, this would have excess unemployment costs.
Svensson concludes with policy implications:
Svensson notes that inflation expectations that are statistically and economically higher than inflation for many years do not pass standard tests of rationality. He builds upon the "near-rational" expectations framework of Akerlof, Dickens, and Perry (2000). In Akerlof et al.'s model, when inflation is fairly close to zero, a fraction of people simply neglect inflation, and behave as if inflation were zero. This is not too unreasonable--it saves them the computational trouble of thinking about inflation and isn't too costly if inflation is really low. Thus, at low rates of inflation, prices and wages are consistently lower relative to nominal aggregate demand than they would be at zero inflation, permitting sustained higher output and employment. At higher levels of inflation, fewer people neglect it. This gives the Phillips Curve has a "hump shape"; unemployment is non-monotonic in inflation but is minimized at some low level of inflation.
In the case of Sweden, the near-rational model is modified because people are not behaving as if inflation were zero, but rather as if it were 2%, when in fact it is lower than 2%. Instead of permitting higher output and employment, the reverse happens. The figure below shows Svensson's interpretation of the Swedish economy's location on its hypothetical modified long-run Phillips curve. The encircled section is where Sweden has been for over a decade, with inflation mostly below 2% and unemployment high. If inflation were to increase above 2%, unemployment would actually decline, because people would still behave as if it were 2%. But there is a limit. If inflation gets too high (beyond about 4% in the figure), people no longer behave as if inflation were 2%, and the inflation-unemployment tradeoff changes sign.
| Source: Svensson 2014 |
As Svensson explains,
"Suppose that nominal wages are set in negotiations a year in advance to achieve a particular target real wage next year at the price level expected for that year. If the inflation expectations equal the inflation target, the price level expected for next year is the current price level increased by the inflation target. This together with the target real wage then determines the level of nominal wages set for next year. If actual inflation over the coming year then falls short of the inflation target, the price level next year will be lower than anticipated, and the real wage will be higher than the target real wage. This will lead to lower employment and higher unemployment."Svensson presents narrative evidence that central wage negotiations in Sweden are indeed influenced by the 2% inflation target rather than by actual inflation. The wage-settlement policy platform of the Industrial Trade Unions states that "[The Riksbank’s inflation target] is an important starting point for the labor-market parties when they negotiate about new wages... In negotiations about new wage settlements, the parties should act as if the Riksbank will attain its inflation target."
The figure below shows the empirical inflation-unemployment relationship in Sweden from 1976 to 2012. The long-run Phillips curve was approximately vertical in the 1970s and 80s. The observations on the far right are the economic crisis of the early 1990s. The points in red are the inflation targeting regime. The downward-sloping black line is the estimated long-run Phillips curve for this regime with average inflation below the credible target. You can see two black dots on the line, at 2% inflation and at 1.4% inflation (the average over the period). The distance between the dots on the unemployment axis is the "excess unemployment" that has resulted from maintaining inflation below target. The unemployment rate would be about 0.8% lower if inflation averaged 2% (and presumable lower still if inflation averaged slightly above 2%).
| Source: Svensson 2014 |
| Source: Svensson 2014 |
"I believe the main policy conclusion to be that if one wants to avoid the average unemployment cost, it is important to keep average inflation over a longer period in line with the target, a kind of average inflation targeting (Nessén and Vestin 2005). This could also be seen as an additional argument in favor of price-level targeting...On the other hand, in Australia, Canada, and the U.K., and more recently in the euro area and the U.S., the central banks have managed to keep average inflation on or close to the target (the implicit target when it is not explicit) without an explicit price-level targeting framework.
Should the central bank try to exploit the downward-sloping long-run Phillips curve and secretly, by being more expansionary, try to keep average inflation somewhat above the target, so as to induce lower average unemployment than for average inflation on target?...This would be inconsistent with an open and transparent monetary policy."
Saturday, May 24, 2014
Kocherlakota's Case for Price Level Targeting
Narayana Kocherlakota, President of the Federal Reserve Bank of Minneapolis, described the benefits of price level targeting to the Economic Club of Minnesota on May 21. He began by explaining that Congress has charged the FOMC with making monetary policy to promote price stability and maximum employment. Since January 2012, the FOMC has interpreted an inflation rate of 2% as most consistent with the price stability part of the mandate.
Since the adoption of the 2% inflation target, inflation, as measured by the annual change in the price index for personal consumption expenditures, has actually been just above 1%. Kocherlakota agrees with the Congressional Budget Office forecast that inflation will not reach 2% until around 2018. He explains why below-target inflation is a problem:
He describes two main benefits of adopting price level targeting, instead of inflation targeting. (His disclaimer: "I won’t take a stand today on which of those approaches is better. My goal is simply to initiate a policy conversation about future—indeed, possibly far-off future—monetary policy choices.") With price level targeting, the central bank targets a set path for the price level, rather than a set rate of change in the price level. If an inflation-targeting central bank undershoots its 2% target one year, it will still target 2% the next year. A price level-targeting central bank could target a path for the price level with a 2% growth rate, but if inflation is less than 2% one year, it will need to be above 2% the next year to get the price level back up to the targeted path. Here are Kocherlakota's two reasons why price level targeting could be a better option:
Meanwhile, other Fed officials and researchers claim that in practice, the FOMC has behaved as if it were price level targeting. St. Louis Fed President James Bullard notes that if we take the 1995 price level and project a 2 percent inflation price level path from that point forward, the actual U.S. price level close to this path. Similarly, Dave Altig and Mike Bryan at the Atlanta Fed calculate that "If you accept that the Fed, for all practical purposes, adopted a 2 percent inflation objective sometime in the early to mid-1990s, there arguably really isn't much material distinction between its inflation-targeting practices and what would have likely happened under a regime that targeted price-level growth at 2 percent per annum. The actual price level today differs by only about 0.5 to 1.5 percentage points from what would be implied by such a price-level target." They explain:
Since the adoption of the 2% inflation target, inflation, as measured by the annual change in the price index for personal consumption expenditures, has actually been just above 1%. Kocherlakota agrees with the Congressional Budget Office forecast that inflation will not reach 2% until around 2018. He explains why below-target inflation is a problem:
"The low inflation in the United States tells us that resources are being wasted. What exactly are these wasted resources? ...the biggest and most disturbing answer is our fellow Americans. There are many productive people in the United States available to work more hours, and our society is deprived of their production.
This key point is generally underappreciated. I’ve said that the FOMC is undershooting its price stability objective and is expected to continue to do so. But we should all keep in mind that this outcome—and especially the forecast for continued undershooting—typically means that the FOMC is also underperforming on its other objective of promoting maximum employment."Kocherlakota notes that "the downside misses with respect to inflation cumulate into a significantly lower price level. If my inflation forecast is right, the price level in 2018 will be about 2.5 percent below what it would have been had the FOMC hit its inflation target over the preceding six years." Then he asks, "How should the FOMC’s inflation goals in the years following 2018 be influenced by the undershooting of the inflation target in the preceding years?"
He describes two main benefits of adopting price level targeting, instead of inflation targeting. (His disclaimer: "I won’t take a stand today on which of those approaches is better. My goal is simply to initiate a policy conversation about future—indeed, possibly far-off future—monetary policy choices.") With price level targeting, the central bank targets a set path for the price level, rather than a set rate of change in the price level. If an inflation-targeting central bank undershoots its 2% target one year, it will still target 2% the next year. A price level-targeting central bank could target a path for the price level with a 2% growth rate, but if inflation is less than 2% one year, it will need to be above 2% the next year to get the price level back up to the targeted path. Here are Kocherlakota's two reasons why price level targeting could be a better option:
"The first reason is that price level targeting makes long-term contracts safer for borrowers and lenders. For example, suppose a family took out a 30-year mortgage in 2012, under the expectation that the FOMC would deliver on its commitment to keep inflation at 2 percent. Because inflation has been so low over the past two years, the borrower’s current repayments are now surprisingly expensive in real terms...The FOMC can’t solve that problem today, But if the FOMC uses inflation targeting, the borrower’s repayments are likely to remain surprisingly expensive in real terms even in 2042...In contrast, if the FOMC uses price level targeting, the borrower’s repayments in 2042 are likely to be close, in real terms, to what the borrower expected when originally taking on the loan.
The second reason that the FOMC might want to use price level targeting is that it would serve as an automatic stabilizer for the economy. As I described earlier, when demand is low, inflation tends to be below target. With price level targeting, the FOMC makes up for low inflation by using monetary policy to stimulate higher future inflation and higher future demand. But this prospect of higher future demand is an incentive for businesses to hire and invest more now. Thus, with price level targeting, the FOMC’s anticipated future policy choices automatically offset current adverse shocks."I don't think a switch to price level targeting is likely in the near term. It would (nearly) be a global first. Only the Swedish Riksbank, from 1931-37, has explicitly targeted the price level. The Bank of Canada, an inflation-targeting regime since 1991, seriously considered switching to price level targeting, but decided against it in 2011.
Meanwhile, other Fed officials and researchers claim that in practice, the FOMC has behaved as if it were price level targeting. St. Louis Fed President James Bullard notes that if we take the 1995 price level and project a 2 percent inflation price level path from that point forward, the actual U.S. price level close to this path. Similarly, Dave Altig and Mike Bryan at the Atlanta Fed calculate that "If you accept that the Fed, for all practical purposes, adopted a 2 percent inflation objective sometime in the early to mid-1990s, there arguably really isn't much material distinction between its inflation-targeting practices and what would have likely happened under a regime that targeted price-level growth at 2 percent per annum. The actual price level today differs by only about 0.5 to 1.5 percentage points from what would be implied by such a price-level target." They explain:
"In principle, there is no reason why a central bank consistently pursuing an inflation target can't deliver the same outcomes as one that specifically and explicitly operates with a price-level target. Misses with respect to targeted inflation need not be biased in one direction or another if the central bank is truly delivering on an average inflation rate consistent with its stated objective."In other words, they are saying that since inflation targeting allows base drift and price level targeting does not, but as long as base drift averages out to zero, there is not much difference. Since the early to mid-90s, the FOMC has approximately balanced out its overshooting and its undershooting of 2% inflation. This is an average over several business cycles, though, so the automatic stabilizer benefits that Kocherlakota mentions would not have been reaped. This also includes the years before the Fed adopted its explicit 2% inflation target. It seems like there was greater willingness to let inflation go above 2% when the target was not explicit. Mark Thoma has noted that comments made by some Fed officials could indicate that the Fed viewed the costs of overshooting and undershooting its target as asymmetric--that the target is actually more of a ceiling. If this is the case, than misses with respect to targeted inflation will likely be biased downward. A shift to treating the target as a true target, with symmetric costs of overshooting and undershooting, and sufficient weight on the employment part of the mandate, may be an easier-to-implement solution than an explicit price-level target.
Friday, January 31, 2014
Inflation Stories of the Week (January 31, 2014)
1. Rajan Signals India Inflation Target Amid Vote Tension (Bloomberg): India central bank Governor Raghuram Rajan may attempt to make inflation the bank's primary priority. Rajan says, "If the government policies in aggregate prove to be
expansionary, we will have to adjust policies ourselves to meet
the overall disinflationary process. We can’t throw up our hands in some
sense and say there is nothing we can do because of the fiscal
dominance."
2. Hungary Rate-Cut Resolve Challenged by Investors as Forint Drops (Bloomberg): Inflation in Hungary is at its lowest since 1970. Central banks in Turkey and South Africa are raising rates to try and stop falling currencies, but the Hungarian central bank faces a challenge because monetary easing is more appropriate to its inflation and growth conditions.
3. Inflation in Euro Zone Falls, and a 12% Jobless Rate Doesn’t Budge (NYT): The 0.7 percent inflation rate may have surprised the ECB.
4. Japan’s Inflation Accelerates as Abe Seeks Wage Gains (Bloomberg): Japan's inflation has inched up, but the real test will come at the annual wage talks in April. Prime Minister Shinzo Abe has met five times since September with business and union leaders to encourage them to raise salaries, which have risen slower than prices.
2. Hungary Rate-Cut Resolve Challenged by Investors as Forint Drops (Bloomberg): Inflation in Hungary is at its lowest since 1970. Central banks in Turkey and South Africa are raising rates to try and stop falling currencies, but the Hungarian central bank faces a challenge because monetary easing is more appropriate to its inflation and growth conditions.
3. Inflation in Euro Zone Falls, and a 12% Jobless Rate Doesn’t Budge (NYT): The 0.7 percent inflation rate may have surprised the ECB.
4. Japan’s Inflation Accelerates as Abe Seeks Wage Gains (Bloomberg): Japan's inflation has inched up, but the real test will come at the annual wage talks in April. Prime Minister Shinzo Abe has met five times since September with business and union leaders to encourage them to raise salaries, which have risen slower than prices.
Monday, August 19, 2013
What Does Abenomics Feel Like?
Depending on whom you ask and when, Abenomics is or is not working, and Japan is or is not entering a recovery. What if you ask the people of Japan?
The closest thing to asking them is looking at the Bank of Japan's Opinion Survey on the General Public's Views and Behavior, a quarterly survey with a nationwide sample of 4,000 individuals who are at least 20 years old. The results from the June 2013 survey were recently released, giving us a glimpse of how the general public of Japan is experiencing economic life under Abe.
When asked, in the abstract, about the "growth potential" of the Japanese economy, responses are less pessimistic than in previous quarters. But when asked about their own household's experience, the situation still looks pretty bleak. In one question, respondents are asked, "What do you think of your household circumstances compared with one year ago?" Only 4.9% say they are better off, while 39.2% say they are worse off, and the rest say it is difficult to tell. While not great, these numbers are a minor improvement over a year prior, when only 3.6% said they were better off and 47% said they were worse off. Of the households who reported worse circumstances, 73% said a reason was that their income decreased and 42% said a reason was that their income was not likely to increase in the future (they could choose multiple options).
The 4.9% of households who thought their circumstances improved were also asked why. About 22% responded that their interest income and dividend payments increased and 26% said it was because the value of their assets increased. Insofar as Abenomics has led to a rising Nikkei, this has only been enough to lead about one or two percent of households to notice improvements in their circumstances. (More households might have benefited from the rise, but not enough to offset other challenges.) The stock market rise greatly increased the net profits of regional banks, but the benefits don't seem to have been widely spread.
Positive inflation and higher inflation expectations are cornerstone goals of Abenomics. Deflation has plagued the Japanese economy since the latter half of the 1990s. Japan's CPI less food and energy rose 0.2% from a year earlier in June, the largest rise since 2008. At Bloomberg, Toru Fujioka and Andy Sharp report that "the world’s third-biggest economy may be starting to shake off 15 years of deflation." Fujioka and Sharp declare this a "Boost for Abe," and write that "the increase in consumer prices could stoke inflation expectations and encourage companies and consumers to spend more, bolstering the economic recovery."
The June 2013 survey shows that consumers are noticing rising prices and expect prices to continue to rise. In particular, 50.5% of survey respondents felt that prices had gone up in the previous year, and over 80% expect prices to go up over the next year. However, of the respondents who noticed rising prices, 81.6% described the price rise as "rather unfavorable." This makes it seem unlikely that stoked inflation expectations will encourage consumers to spend more. In fact, 44.8% of respondents plan to decrease their spending over the next year, and only 6.1% plan to increase spending.
I previously wrote a post about how Europeans really dislike inflation, even when it is low, but I think the reason Japanese consumers dread rising prices is different. If price inflation is not accompanied by wage inflation--and is not expected to be-- then the pass-through from inflation expectations to consumer spending is broken. Fujioka and Sharp quote Akiyoshi Takumori, chief economist at Sumitomo Mitsui Asset Management, saying “business executives must have forgotten how to increase pay after decades of deflation." Japanese companies are reluctant to raise base pay. In June, while average total monthly cash earnings, including overtime and bonuses, rose 0.1%, regular pay fell 0.2%. The rise in total earnings was attributable to higher summer bonuses. Over 80% of survey respondents are slightly or quite worried about working conditions such as pay, job position, and benefits.
Subscribe to:
Posts (Atom)