In recent months, there has been no notable change in inflation uncertainty at either horizon.
Showing posts with label inflation. Show all posts
Thursday, December 7, 2017
Consumer Inflation Uncertainty Holding Steady
I recently updated my Consumer Inflation Uncertainty Index through October 2017. Data is available here and the official (gated) publication in the Journal of Monetary Economics is here. Inflation uncertainty remains low by historic standards. Uncertainty about longer-run (5- to 10-year ahead) inflation remains lower than uncertainty about next-year inflation.
The average "less uncertain" type consumer still expects longer-run inflation around 2.4%, while the longer-run inflation forecasts of "highly uncertain" consumers have risen in recent months to the 8-10% range.
Tuesday, October 24, 2017
Is Taylor a Hawk or Not?
Two Bloomberg articles published just a week apart call John Taylor, a contender for Fed Chair, first hawkish, then dovish. The first, by Garfield Clinton Reynolds, notes:
...The dollar rose and the 10-year U.S. Treasury note fell on Monday after Bloomberg News reported Taylor, a professor at Stanford University, impressed President Donald Trump in a recent White House interview.
Driving those trades was speculation that the 70 year-old Taylor would push rates up to higher levels than a Fed helmed by its current chair, Janet Yellen. That’s because he is the architect of the Taylor Rule, a tool widely used among policy makers as a guide for setting rates since he developed it in the early 1990s.But the second, by Rich Miller, claims that "Taylor’s Walk on Supply Side May Leave Him More Dove Than Yellen." Miller explains,
"While Taylor believes the [Trump] administration can substantially lift non-inflationary economic growth through deregulation and tax changes, Yellen is more cautious. That suggests that the Republican Taylor would be less prone than the Democrat Yellen to raise interest rates in response to a policy-driven economic pick-up."What actually makes someone a hawk? Simply favoring rules-based policy is not enough. A central banker could use a variation of the Taylor rule that implies very little response to inflation, or that allows very high average inflation. Beliefs about the efficacy of supply-side policies also do not determine hawk or dove status. Let's look at the Taylor rule from Taylor's 1993 paper:
r = p + .5y + .5(p – 2) + 2,where r is the federal funds rate, y is the percent deviation of real GDP from target, and p is inflation over the previous 4 quarters. Taylor notes (p. 202) that lagged inflation is used as a proxy for expected inflation, and y=100(Y-Y*)/Y* where Y is real GDP and Y* is trend GDP (a proxy for potential GDP).
The 0.5 coefficients on the y and (p-2) terms reflect how Taylor estimated that the Fed approximately behaved, but in general a Taylor rule could have different coefficients, reflecting the central bank's preferences. The bank could also have an inflation target p* not equal to 2, and replace (p-2) with (p-p*). Just being really committed to following a Taylor rule does not tell you what steady state inflation rate or how much volatility a central banker would allow. For example, a central bank could follow a rule with p*=5 and a relatively large coefficient on y and small coefficient on (p-5), allowing both high and volatile inflation.
What do "supply side" beliefs imply? Well, Miller thinks that Taylor believes the Trump tax and deregulatory policy changes will raise potential GDP, or Y*. For a given value of Y, a higher estimate of Y* implies a lower estimate of y, which implies lower r. So yes, in the very short run, we could see lower r from a central banker who "believes" in supply side economics than from one who doesn't, all else equal.
But what if Y* does not really rise as much as a supply-sider central banker thinks it will? Then the lower r will result in higher p (and Y), to which the central bank will react by raising r. So long as the central bank follows the Taylor principle (so the sum of the coefficients on p and (p-p*) in the rule are greater than 1), equilibrium long-run inflation is p*.
The parameters of the Taylor rule reflect the central bank's preferences. The right-hand-side variables, like Y*, are measured or forecasted. That reflects a central bank's competence at measuring and forecasting, which depends on a number of factors ranging from the strength of its staff economists to the priors of the Fed Chair to the volatility and unpredictability of other economic conditions and policies.
Neither Taylor nor Yellen seems likely to change the inflation target to something other than 2 (and even if they wanted to, they could not unilaterally make that decision.) They do likely differ in their preferences for stabilizing inflation versus stabilizing output, and in that respect I'd guess Taylor is more hawkish.
Yellen's efforts to look at alternative measures of labor market conditions in the past are also about Y*. In some versions of the Taylor rule, you see unemployment measures instead of output measures (where the idea is that they generally comove). Willingness to consider multiple measures of employment and/or output is really just an attempt to get a better measure on how far the real economy is from "potential." It doesn't make a person inherently more or less hawkish.
As an aside, this whole discussion presumes that monetary policy itself (or more generally, aggregate demand shifts) do not change Y*. Hysteresis theories reject that premise.
Friday, October 13, 2017
Rethinking Macroeconomic Policy
I had the pleasure of attending “Rethinking Macroeconomic Policy IV” at the Peterson Institute for International Economics. I highly recommend viewing the panels and materials online.
The two-day conference left me wondering what it actually means to “rethink” macro. The conference title refers to rethinking macroeconomic policy, not macroeconomic research or analysis, but of course these are related. Adam Posen’s opening remarks expressed dissatisfaction with DSGE models, VARs, and the like, and these sentiments were occasionally echoed in the other panels in the context of the potentially large role of nonlinearities in economic dynamics. Then, in the opening session, Olivier Blanchard talked about whether we need a “revolution” or “evolution” in macroeconomic thought. He leans toward the latter, while his coauthor Larry Summers leans toward the former. But what could either of these look like? How could we replace or transform the existing modes of analysis?
I looked back on the materials from Rethinking Macroeconomic Policy of 2010. Many of the policy challenges discussed at that conference are still among the biggest challenges today. For example, low inflation and low nominal interest rates limit the scope of monetary policy in recessions. In 2010, raising the inflation target and strengthening automatic fiscal stabilizers were both suggested as possible policy solutions meriting further research and discussion. Inflation and nominal rates are still very low seven years later, and higher inflation targets and stronger automatic stabilizers are still discussed, but what I don’t see is a serious proposal for change in the way we evaluate these policy proposals.
Plenty of papers use basically standard macro models and simulations to quantify the costs and benefits of raising the inflation target. Should we care? Should we discard them and rely solely on intuition? I’d say: probably yes, and probably no. Will we (academics and think tankers) ever feel confident enough in these results to make a real policy change? Maybe, but then it might not be up to us.
Ben Bernanke raised probably the most specific and novel policy idea of the conference, a monetary policy framework that would resemble a hybrid of inflation targeting and price level targeting. In normal times, the central bank would have a 2% inflation target. At the zero lower bound, the central bank would allow inflation to rise above the 2% target until inflation over the duration of the ZLB episode averaged 2%. He suggested that this framework would have some of the benefits of a higher inflation target and of price level targeting without some of the associated costs. Inflation would average 2%, so distortions from higher inflation associated with a 4% target would be avoided. The possibly adverse credibility costs of switching to a higher target would also be minimized. The policy would provide the usual benefits of history-dependence associated with price level targeting, without the problems that this poses when there are oil shocks.
It’s an exciting idea, and intuitively really appealing to me. But how should the Fed ever decide whether or not to implement it? Bernanke mentioned that economists at the Board are working on simulations of this policy. I would guess that these simulations involve many of the assumptions and linearizations that rethinking types love to demonize. So again: Should we care? Should we rely solely on intuition and verbal reasoning? What else is there?
Later, Jason Furman presented a paper titled, “Should policymakers care whether inequality is helpful or harmful for growth?” He discussed some examples of evaluating tradeoffs between output and distribution in toy models of tax reform. He begins with the Mankiw and Weinzierl (2006) example of a 10 percent reduction in labor taxes paid for by a lump-sum tax. In a Ramsey model with a representative agent, this policy change would raise output by 1 percent. Replacing the representative agent with agents with the actual 2010 distribution of U.S. incomes, only 46 percent of households would see their after-tax income increase and 41 percent would see their welfare increase. More generally, he claims that “the growth effects of tax changes are about an order of magnitude smaller than the distributional effects of tax changes—and the disparity between the welfare and distribution effects is even larger” (14). He concludes:
As Posen then pointed out, Furman’s paper and his discussants largely ignored the discussions of macroeconomic stabilization and business cycles that dominated the previous sessions on monetary and fiscal policy. The panelists acceded that recessions, and hysteresis in unemployment, can exacerbate economic disparities. But the fact that stabilization policy was so disconnected from the initial discussion of inequality and growth shows just how much rethinking still has not occurred.
In 1987, Robert Lucas calculated that the welfare costs of business cycles are minimal. In some sense, we have “rethought” this finding. We know that it is built on assumptions of a representative agent and no hysteresis, among other things. And given the emphasis in the fiscal and monetary policy sessions on avoiding or minimizing business cycle fluctuations, clearly we believe that the costs of business cycle fluctuations are in fact quite large. I doubt many economists would agree with the statement that “the welfare costs of business cycles are minimal.” Yet, the public finance literature, even as presented at a conference on rethinking macroeconomic policy, still evaluates welfare effects of policy using models that totally omit business cycle fluctuations, because, within those models, such fluctuations hardly matter for welfare. If we believe that the models are “wrong” in their implications for the welfare effects of fluctuations, why are we willing to take their implications for the welfare effects of tax policies at face value?
I don’t have a good alternative—but if there is a Rethinking Macroeconomic Policy V, I hope some will be suggested. The fact that the conference speakers are so distinguished is both an upside and a downside. They have the greatest understanding of our current models and policies, and in many cases were central to developing them. They can rethink, because they have already thought, and moreover, they have large influence and loud platforms. But they are also quite invested in the status quo, for all they might criticize it, in a way that may prevent really radical rethinking (if it is really needed, which I’m not yet convinced of). (A more minor personal downside is that I was asked multiple times whether I was an intern.)
If there is a Rethinking Macroeconomic Policy V, I also hope that there will be a session on teaching and training. The real rethinking is going to come from the next generations of economists. How do we help them learn and benefit from the current state of economic knowledge without being constrained by it? This session could also touch on continuing education for current economists. What kinds of skills should we be trying to develop now? What interdisciplinary overtures should we be making?
The two-day conference left me wondering what it actually means to “rethink” macro. The conference title refers to rethinking macroeconomic policy, not macroeconomic research or analysis, but of course these are related. Adam Posen’s opening remarks expressed dissatisfaction with DSGE models, VARs, and the like, and these sentiments were occasionally echoed in the other panels in the context of the potentially large role of nonlinearities in economic dynamics. Then, in the opening session, Olivier Blanchard talked about whether we need a “revolution” or “evolution” in macroeconomic thought. He leans toward the latter, while his coauthor Larry Summers leans toward the former. But what could either of these look like? How could we replace or transform the existing modes of analysis?
I looked back on the materials from Rethinking Macroeconomic Policy of 2010. Many of the policy challenges discussed at that conference are still among the biggest challenges today. For example, low inflation and low nominal interest rates limit the scope of monetary policy in recessions. In 2010, raising the inflation target and strengthening automatic fiscal stabilizers were both suggested as possible policy solutions meriting further research and discussion. Inflation and nominal rates are still very low seven years later, and higher inflation targets and stronger automatic stabilizers are still discussed, but what I don’t see is a serious proposal for change in the way we evaluate these policy proposals.
Plenty of papers use basically standard macro models and simulations to quantify the costs and benefits of raising the inflation target. Should we care? Should we discard them and rely solely on intuition? I’d say: probably yes, and probably no. Will we (academics and think tankers) ever feel confident enough in these results to make a real policy change? Maybe, but then it might not be up to us.
Ben Bernanke raised probably the most specific and novel policy idea of the conference, a monetary policy framework that would resemble a hybrid of inflation targeting and price level targeting. In normal times, the central bank would have a 2% inflation target. At the zero lower bound, the central bank would allow inflation to rise above the 2% target until inflation over the duration of the ZLB episode averaged 2%. He suggested that this framework would have some of the benefits of a higher inflation target and of price level targeting without some of the associated costs. Inflation would average 2%, so distortions from higher inflation associated with a 4% target would be avoided. The possibly adverse credibility costs of switching to a higher target would also be minimized. The policy would provide the usual benefits of history-dependence associated with price level targeting, without the problems that this poses when there are oil shocks.
It’s an exciting idea, and intuitively really appealing to me. But how should the Fed ever decide whether or not to implement it? Bernanke mentioned that economists at the Board are working on simulations of this policy. I would guess that these simulations involve many of the assumptions and linearizations that rethinking types love to demonize. So again: Should we care? Should we rely solely on intuition and verbal reasoning? What else is there?
Later, Jason Furman presented a paper titled, “Should policymakers care whether inequality is helpful or harmful for growth?” He discussed some examples of evaluating tradeoffs between output and distribution in toy models of tax reform. He begins with the Mankiw and Weinzierl (2006) example of a 10 percent reduction in labor taxes paid for by a lump-sum tax. In a Ramsey model with a representative agent, this policy change would raise output by 1 percent. Replacing the representative agent with agents with the actual 2010 distribution of U.S. incomes, only 46 percent of households would see their after-tax income increase and 41 percent would see their welfare increase. More generally, he claims that “the growth effects of tax changes are about an order of magnitude smaller than the distributional effects of tax changes—and the disparity between the welfare and distribution effects is even larger” (14). He concludes:
“a welfarist analyzing tax policies that entail tradeoffs between efficiency and equity would not be far off in just looking at static distribution tables and ignoring any dynamic effects altogether. This is true for just about any social welfare function that places a greater weight on absolute gains for households at the bottom than at the top. Under such an approach policymaking could still be done under a lexicographic process—so two tax plans with the same distribution would be evaluated on the basis of whichever had higher growth rates…but in this case growth would be the last consideration, not the first” (16).
As Posen then pointed out, Furman’s paper and his discussants largely ignored the discussions of macroeconomic stabilization and business cycles that dominated the previous sessions on monetary and fiscal policy. The panelists acceded that recessions, and hysteresis in unemployment, can exacerbate economic disparities. But the fact that stabilization policy was so disconnected from the initial discussion of inequality and growth shows just how much rethinking still has not occurred.
In 1987, Robert Lucas calculated that the welfare costs of business cycles are minimal. In some sense, we have “rethought” this finding. We know that it is built on assumptions of a representative agent and no hysteresis, among other things. And given the emphasis in the fiscal and monetary policy sessions on avoiding or minimizing business cycle fluctuations, clearly we believe that the costs of business cycle fluctuations are in fact quite large. I doubt many economists would agree with the statement that “the welfare costs of business cycles are minimal.” Yet, the public finance literature, even as presented at a conference on rethinking macroeconomic policy, still evaluates welfare effects of policy using models that totally omit business cycle fluctuations, because, within those models, such fluctuations hardly matter for welfare. If we believe that the models are “wrong” in their implications for the welfare effects of fluctuations, why are we willing to take their implications for the welfare effects of tax policies at face value?
I don’t have a good alternative—but if there is a Rethinking Macroeconomic Policy V, I hope some will be suggested. The fact that the conference speakers are so distinguished is both an upside and a downside. They have the greatest understanding of our current models and policies, and in many cases were central to developing them. They can rethink, because they have already thought, and moreover, they have large influence and loud platforms. But they are also quite invested in the status quo, for all they might criticize it, in a way that may prevent really radical rethinking (if it is really needed, which I’m not yet convinced of). (A more minor personal downside is that I was asked multiple times whether I was an intern.)
If there is a Rethinking Macroeconomic Policy V, I also hope that there will be a session on teaching and training. The real rethinking is going to come from the next generations of economists. How do we help them learn and benefit from the current state of economic knowledge without being constrained by it? This session could also touch on continuing education for current economists. What kinds of skills should we be trying to develop now? What interdisciplinary overtures should we be making?
Thursday, September 28, 2017
An Inflation Expectations Experiment
Last semester, my senior thesis advisee Alex Rodrigue conducted a survey-based information experiment via Amazon Mechanical Turk. We have coauthored a working paper detailing the experiment and results titled "Household Informedness and Long-Run Inflation Expectations: Experimental Evidence." I presented our research at my department seminar yesterday with the twin babies in tow, and my tweet about the experience is by far my most popular to date:
As shown in the figure above, before receiving the treatments, very few respondents forecast 2% inflation over the long-run and only about a third even forecast in the 1-3% range. Over half report a multiple-of-5% forecast, which, as I argue in a recent paper in the Journal of Monetary Economics, is a likely sign of high uncertainty. When presented with a graph of the past 15 years of inflation, or with the FOMC statement announcing the 2% target, the average respondent revises their forecast around 2 percentage points closer to the target. Uncertainty also declines.
The results are consistent with imperfect information models because the information treatments are publicly available, yet respondents still revise their expectations after the treatments. Low informedness is part of the reason why expectations are far from the target. The results are also consistent with Bayesian updating, in the sense that high prior uncertainty is associated with larger revisions. But equally noteworthy is the fact that even after receiving both treatments, expectations are still quite heterogeneous and many still substantially depart from the target. So people seem to interpret the information in different ways and view it as imperfectly credible.
We look at how treatment effects vary by respondent characteristic. One interesting result is that, after receiving both treatments, the discrepancy between mean male and female inflation expectations (which has been noted in many studies) nearly disappears (see figure below).
There is more in the paper about how treatment effects vary with other characteristics, including respondents' opinion of government policy and their prior knowledge. We also look at whether expectations can be "un-anchored from below" with the graph treatment.
Consumers' inflation expectations are very disperse; on household surveys, many people report long-run inflation expectations that are far from the Fed's 2% target. Are these people unaware of the target, or do they know it but remain unconvinced of its credibility? In another paper in the Journal of Macroeconomics, I provide some non-experimental evidence that public knowledge of the Fed and its objectives is quite limited. In this paper, we directly treat respondents with information about the target and about past inflation, in randomized order, and see how they revise their reported long-run inflation expectations. We also collect some information about their prior knowledge of the Fed and the target, their self-reported understanding of inflation, and their numeracy and demographic characteristics. About a quarter of respondents knew the Fed's target and two-thirds could identify Yellen as Fed Chair from a list of three options.I gave a 90 minute econ seminar today with the twin babies, both awake. Held one and audience passed the other around. A first in economics?— Carola Conces Binder (@cconces) September 28, 2017
As shown in the figure above, before receiving the treatments, very few respondents forecast 2% inflation over the long-run and only about a third even forecast in the 1-3% range. Over half report a multiple-of-5% forecast, which, as I argue in a recent paper in the Journal of Monetary Economics, is a likely sign of high uncertainty. When presented with a graph of the past 15 years of inflation, or with the FOMC statement announcing the 2% target, the average respondent revises their forecast around 2 percentage points closer to the target. Uncertainty also declines.
The results are consistent with imperfect information models because the information treatments are publicly available, yet respondents still revise their expectations after the treatments. Low informedness is part of the reason why expectations are far from the target. The results are also consistent with Bayesian updating, in the sense that high prior uncertainty is associated with larger revisions. But equally noteworthy is the fact that even after receiving both treatments, expectations are still quite heterogeneous and many still substantially depart from the target. So people seem to interpret the information in different ways and view it as imperfectly credible.
We look at how treatment effects vary by respondent characteristic. One interesting result is that, after receiving both treatments, the discrepancy between mean male and female inflation expectations (which has been noted in many studies) nearly disappears (see figure below).
There is more in the paper about how treatment effects vary with other characteristics, including respondents' opinion of government policy and their prior knowledge. We also look at whether expectations can be "un-anchored from below" with the graph treatment.
Thursday, September 14, 2017
Consumer Forecast Revisions: Is Information Really so Sticky?
My paper "Consumer Forecast Revisions: Is Information Really so Sticky?" was just accepted for publication in Economics Letters. This is a short paper that I believe makes an important point.
Then I transform the data so that it is like the MSC data. First I round the responses to the nearest integer. This makes the updating frequency estimates decrease a little. Then I look at it at the six-month frequency instead of monthly. This makes the updating frequency estimates decrease a lot, and I find similar estimates to the previous literature-- updates about every 8 months.
So low-frequency data, and, to a lesser extent, rounded responses, result in large underestimates of revision frequency (or equivalently, overestimates of information stickiness). And if information is not really so sticky, then sticky information models may not be as good at explaining aggregate dynamics. Other classes of imperfect information models, or sticky information models combined with other classes of models, might be better.
Read the ungated version here. I will post a link to the official version when it is published.
Sticky information models are one way of modeling imperfect information. In these models, only a fraction (λ) of agents update their information sets each period. If λ is low, information is quite sticky, and that can have important implications for macroeconomic dynamics. There have been several empirical approaches to estimating λ. With micro-level survey data, a non-parametric and time-varying estimate of λ can be obtained by calculating the
fraction of respondents who revise their forecasts (say, for inflation) at each survey date. Estimates from the Michigan Survey of Consumers (MSC) imply that consumers update their information about inflation approximately once every 8 months.
Here are two issues that I point out with these estimates:
I show that several issues with estimates of information stickiness based on consumer survey microdata lead to substantial underestimation of the frequency with which consumers update their expectations. The first issue stems from data frequency. The rotating panel of Michigan Survey of Consumer (MSC) respondents take the survey twice with a six-month gap. A consumer may have the same forecast at months t and t+ 6 but different forecasts in between. The second issue is that responses are reported to the nearest integer. A consumer may update her information, but if the update results in a sufficiently small revisions, it will appear that she has not updated her information.To quantify how these issues matter, I use data from the New York Fed Survey of Consumer Expectations, which is available monthly and not rounded to the nearest integer. I compute updating frequency with this data. It is very high-- at least 5 revisions in 8 months, as opposed to the 1 revision per 8 months found in previous literature.
Then I transform the data so that it is like the MSC data. First I round the responses to the nearest integer. This makes the updating frequency estimates decrease a little. Then I look at it at the six-month frequency instead of monthly. This makes the updating frequency estimates decrease a lot, and I find similar estimates to the previous literature-- updates about every 8 months.
So low-frequency data, and, to a lesser extent, rounded responses, result in large underestimates of revision frequency (or equivalently, overestimates of information stickiness). And if information is not really so sticky, then sticky information models may not be as good at explaining aggregate dynamics. Other classes of imperfect information models, or sticky information models combined with other classes of models, might be better.
Read the ungated version here. I will post a link to the official version when it is published.
Monday, August 21, 2017
New Argument for a Higher Inflation Target
On voxeu.org, Philippe Aghion, Antonin Bergeaud, Timo Boppart, Peter Klenow, and Huiyu Li discuss their recent work on the measurement of output and whether measurement bias can account for the measured slowdown in productivity growth. While the work is mostly relevant to discussions of the productivity slowdown and secular stagnation, I was interested in a corollary that ties it to discussions of the optimal level of the inflation target.
The authors note the high frequency of "creative destruction" in the US, which they define as when "products exit the market because they are eclipsed by a better product sold by a new producer." This presents a challenge for statistical offices trying to measure inflation:
The standard procedure in such cases is to assume that the quality-adjusted inflation rate is the same as for other items in the same category that the statistical office can follow over time, i.e. products that are not subject to creative destruction. However, creative destruction implies that the new products enter the market because they have a lower quality-adjusted price. Our study tries to quantify the bias that arises from relying on imputation to measure US productivity growth in cases of creative destruction.
They explain that this can lead to mismeasurement of TFP growth, which they quantify by examining changes in the share of incumbent products over time:
If the statistical office is correct to assume that the quality-adjusted inflation rate is the same for creatively destroyed products as for surviving incumbent products, then the market share of surviving incumbent products should stay constant over time. If instead the market share of these incumbent products shrinks systematically over time, then the surviving subset of products must have higher average inflation than creatively destroyed products. For a given elasticity of substitution between products, the more the market share shrinks for surviving products, the more the missing growth.
From 1983 to 2013, they estimate that "missing growth" averaged about 0.63% per year. This is substantial, but there is no clear time trend (i.e. there is not more missed growth in recent years), so it can't account for the measured productivity growth slowdown.
The authors suggest that the Fed should consider adjusting its inflation target upwards to "get closer to achieving quality-adjusted price stability." A few months ago, 22 economists including Joseph Stiglitz and Narayana Kocherlakota wrote a letter urging the Fed to consider raising its inflation target, in which they stated:
Policymakers must be willing to rigorously assess the costs and benefits of previously-accepted policy parameters in response to economic changes. One of these key parameters that should be rigorously reassessed is the very low inflation targets that have guided monetary policy in recent decades. We believe that the Fed should appoint a diverse and representative blue ribbon commission with expertise, integrity, and transparency to evaluate and expeditiously recommend a path forward on these questions.
The letter did not mention this measurement bias rationale for a higher target, but the blue ribbon commission they propose should take it into consideration.
Friday, August 18, 2017
The Low Misery Dilemma
The other day, Tim Duy tweeted:
The misery index is the sum of unemployment and inflation. Arthur Okun proposed it in the 1960s as a crude gauge of the economy, based on the fact that high inflation and high unemployment are both miserable (so high values of the index are bad). The misery index was pretty low in the 60s, in the 6% to 8% range, similar to where it has been since around 2014. Now it is around 6%. Great, right?
The NYT article notes that we are in an opposite situation to the stagflation of the 1970s and early 80s, when both high inflation and high unemployment were concerns. The misery index reached a high of 21% in 1980. (The unemployment data is only available since 1948).
Very high inflation and high unemployment are each individually troubling for the social welfare costs they impose (which are more obvious for unemployment). But observed together, they also troubled economists for seeming to run contrary to the Phillips curve-based models of the time. The tradeoff between inflation and unemployment wasn't what economists and policymakers had believed, and their misunderstanding probably contributed to the misery.
Though economic theory has evolved, the basic Phillips curve tradeoff idea is still an important part of central bankers' models. By models, I mean both the formal quantitative models used by their staffs and the way they think about how the world works. General idea: if the economy is above full employment, that should put upward pressure on wages, which should put upward pressure on prices.
So low unemployment combined with low inflation seem like a nice problem to have, but if they are indeed a new reality-- that is, something that will last--then there is something amiss in that chain of logic. Maybe we are not at full employment, because the natural rate of unemployment is a lot lower than we thought, or we are looking at the wrong labor market indicators. Maybe full employment does not put upward pressure on wages, for some reason, or maybe we are looking at the wrong wage measures. For example, San Francisco Fed researchers argue that wage growth measures should be adjusted in light of retiring Baby Boomers. Or maybe the link between wage and price inflation has weakened.
Until policymakers feel confident that they understand why we are experiencing both low inflation and low unemployment, they can't simply embrace the low misery. It is natural that they will worry that they are missing something, and that the consequences of whatever that is could be disastrous. The question is what to do in the meanwhile.
There are two camps for Fed policy. One camp favors a wait-and-see approach: hold rates steady until we actually observe inflation rising above 2%. Maybe even let it stay above 2% for awhile, to make up for the lengthy period of below-2% inflation. The other camp favors raising rates preemptively, just in case we are missing some sign that inflation is about to spiral out of control. This latter possibility strikes me as unlikely, but I'm admittedly oversimplifying the concerns, and also haven't personally experienced high inflation.
It took me a moment--and I'd guess I'm not alone--to even recognize how remarkable this is. The New York Times ran an article with the headline "Fed Officials Confront New Reality: Low Inflation and Low Unemployment." Confront, not embrace, not celebrate.I expect the FOMC minutes to reveal that some participants were concerned about low inflation while others focused on low unemployment.— Tim Duy (@TimDuy) August 16, 2017
The misery index is the sum of unemployment and inflation. Arthur Okun proposed it in the 1960s as a crude gauge of the economy, based on the fact that high inflation and high unemployment are both miserable (so high values of the index are bad). The misery index was pretty low in the 60s, in the 6% to 8% range, similar to where it has been since around 2014. Now it is around 6%. Great, right?
The NYT article notes that we are in an opposite situation to the stagflation of the 1970s and early 80s, when both high inflation and high unemployment were concerns. The misery index reached a high of 21% in 1980. (The unemployment data is only available since 1948).
Very high inflation and high unemployment are each individually troubling for the social welfare costs they impose (which are more obvious for unemployment). But observed together, they also troubled economists for seeming to run contrary to the Phillips curve-based models of the time. The tradeoff between inflation and unemployment wasn't what economists and policymakers had believed, and their misunderstanding probably contributed to the misery.
Though economic theory has evolved, the basic Phillips curve tradeoff idea is still an important part of central bankers' models. By models, I mean both the formal quantitative models used by their staffs and the way they think about how the world works. General idea: if the economy is above full employment, that should put upward pressure on wages, which should put upward pressure on prices.
So low unemployment combined with low inflation seem like a nice problem to have, but if they are indeed a new reality-- that is, something that will last--then there is something amiss in that chain of logic. Maybe we are not at full employment, because the natural rate of unemployment is a lot lower than we thought, or we are looking at the wrong labor market indicators. Maybe full employment does not put upward pressure on wages, for some reason, or maybe we are looking at the wrong wage measures. For example, San Francisco Fed researchers argue that wage growth measures should be adjusted in light of retiring Baby Boomers. Or maybe the link between wage and price inflation has weakened.
Until policymakers feel confident that they understand why we are experiencing both low inflation and low unemployment, they can't simply embrace the low misery. It is natural that they will worry that they are missing something, and that the consequences of whatever that is could be disastrous. The question is what to do in the meanwhile.
There are two camps for Fed policy. One camp favors a wait-and-see approach: hold rates steady until we actually observe inflation rising above 2%. Maybe even let it stay above 2% for awhile, to make up for the lengthy period of below-2% inflation. The other camp favors raising rates preemptively, just in case we are missing some sign that inflation is about to spiral out of control. This latter possibility strikes me as unlikely, but I'm admittedly oversimplifying the concerns, and also haven't personally experienced high inflation.
Wednesday, May 31, 2017
Low Inflation at "Essentially Full Employment"
Yesterday, Brad Delong took issue with Charles Evans' recent claim that "Today, we have essentially returned to full employment in the U.S." Evans, President of the Federal Reserve Bank of Chicago and a member of the FOMC, was speaking before the Bank of Japan Institute for Monetary and Economic Studies in Tokyo on "lessons learned and challenges ahead" in monetary policy. Delong points out that the age 25-54 employment-to-population ratio in the United States of 78.5% is low by historical standards and given social and demographic trends.
Evans' claim that the U.S. has returned to full employment is followed by his comment that "Unfortunately, low inflation has been more stubborn, being slower to return to our objective. From 2009 to the present, core PCE inflation, which strips out the volatile food and energy components, has underrun 2% and often by substantial amounts." Delong asks,
As Christopher Erceg and Andrew Levin explain, a recession of moderate size and severity does not prompt many departures from the labor market, but long recessions can produce quite pronounced declines in labor force participation. In their model, this gradual response of labor force participation to the unemployment rate arises from high adjustment costs of moving in and out of the formal labor market. But the Great Recession was protracted enough to lead people to leave the labor force despite the adjustment costs. According to their analysis:
Erceg and Levin also discuss implications for monetary policy design, considering the consequences of responding to the cyclical component of the LFPR in addition to the unemployment rate.
Evans' claim that the U.S. has returned to full employment is followed by his comment that "Unfortunately, low inflation has been more stubborn, being slower to return to our objective. From 2009 to the present, core PCE inflation, which strips out the volatile food and energy components, has underrun 2% and often by substantial amounts." Delong asks,
And why the puzzlement at the failure of core inflation to rise to 2%? That is a puzzle only if you assume that you know with certainty that the unemployment rate is the right variable to put on the right hand side of the Phillips Curve. If you say that the right variable is equal to some combination with weight λ on prime-age employment-to-population and weight 1-λ on the unemployment rate, then there is no puzzle—there is simply information about what the current value of λ is.It is not totally obvious why prime-age employment-to-population should drive inflation distinctly from unemployment--that is, why Delong's λ should not be zero, as in the standard Phillips Curve. Note that the employment-to-population ratio grows with the labor force participation rate (LFPR) and declines with the unemployment rate. Typically, labor force participation is mostly acyclical: its longer run trends dwarf any movements at the business cycle frequency (see graph below). So in a normal recession, the decline in the employment-to-population ratio is mostly attributable to the rise in the unemployment rate, not the fall in LFPR (so it shouldn't really matter if you simply impose λ=0).
![]() |
https://fred.stlouisfed.org/series/LNS11300060 |
cyclical factors can fully account for the post-2007 decline of 1.5 percentage points in the LFPR for prime-age adults (i.e., 25–54 years old). We define the labor force participation gap as the deviation of the LFPR from its potential path implied by demographic and structural considerations, and we find that as of mid-2013 this gap stood at around 2%. Indeed, our analysis suggests that the labor force gap and the unemployment gap each accounts for roughly half of the current employment gap, that is, the shortfall of the employment-to-population rate from its precrisis trend.Erceg and Levin discuss their results in the context of the Phillips Curve, noting that "a large negative participation gap induces labor force participants to reduce their wage demands, although our calibration implies that the participation gap has less influence than the unemployment rate quantitatively." This means that both unemployment and labor force participation enter the right hand side of the Phillips Curve (and Delong's λ is nonzero), so if a deep recession leaves the LFPR (and, accordingly, the employment-to-population ratio) low even as unemployment returns to its natural rate, inflation will still remain low.
Erceg and Levin also discuss implications for monetary policy design, considering the consequences of responding to the cyclical component of the LFPR in addition to the unemployment rate.
We use our model to analyze the implications of alternative monetary policy strategies against the backdrop of a deep recession that leaves the LFPR well below its longer run potential level. Specifically, we compare a noninertial Taylor rule, which responds to inflation and the unemployment gap to an augmented rule that also responds to the participation gap. In the simulations, the zero lower bound precludes the central bank from lowering policy rates enough to offset the aggregate demand shock for some time, producing a deep recession; once the shock dies away sufficiently, policy responds according to the Taylor rule. A key result of our analysis is that monetary policy can induce a more rapid closure of the participation gap through allowing the unemployment rate to fall below its longrun natural rate. Quite intuitively, keeping unemployment persistently low draws cyclical nonparticipants back into labor force more quickly. Given that the cyclical nonparticipants exert some downward pressure on inflation, some undershooting of the long-run natural rate actually turns out to be consistent with keeping inflation stable in our model.While the authors don't explicitly use the phrase "full employment," their paper does provide a rationale for the low core inflation we're experiencing despite low unemployment. Erceg and Levin's paper was published in the Journal of Money, Credit, and Banking in 2014; ungated working paper versions from 2013 are available here.
Sunday, January 8, 2017
Post-Election Political Divergence in Economic Expectations
"Note that among Democrats, year-ahead income expectations fell and year-ahead inflation expectations rose, and among Republicans, income expectations rose and inflation expectations fell. Perhaps the most drastic shifts were in unemployment expectations:rising unemployment was anticipated by 46% of Democrats in December, up from just 17% in June, but for Republicans, rising unemployment was anticipated by just 3% in December, down from 41% in June. The initial response of both Republicans and Democrats to Trump’s election is as clear as it is unsustainable: one side anticipates an economic downturn, and the other expects very robust economic growth."This is from Richard Curtin, Director of the Michigan Survey of Consumers. He is comparing the economic sentiments and expectations of Democrats, Independents, and Republicans who took the survey in June and December 2016. A subset of survey respondents take the survey twice, with a six-month gap. So these are the respondents who took the survey before and after the election. The results are summarized in the table below, and really are striking, especially with regards to unemployment. Inflation expectations also rose for Democrats and fell for Republicans (and the way I interpret the survey data is that most consumers see inflation as a bad thing, so lower inflation expectations means greater optimism.)
Notice, too, that self-declared Independents are more optimistic after the election than before. More of them are expecting lower unemployment and fewer are expecting higher unemployment. Inflation expectations also fell from 3% to 2.3%, and income expectations rose. Of course, this is likely based on a very small sample size.
Source: Richard Curtin, Michigan Survey of Consumers |
Monday, December 5, 2016
The Future is Uncertain, but So Is the Past
In a recently-released research note, Federal Reserve Board economists Alan Detmeister, David Lebow, and Ekaterina Peneva summarize new survey results on consumers' inflation perceptions. The well-known Michigan Survey of Consumers asks consumers about their expectations of future inflation (over the next year and 5- to 10- years), but does not ask them what they believe inflation has been in recent years.
In many macroeconomic models, inflation perceptions should be nearly perfect. After all, inflation statistics are publicly available, and anyone should be able to access them. The Federal Reserve commissioned the Michigan Survey of Consumers Research Center to survey consumers about their perceptions of inflation over the past year and over the past 5- to 10-years, using analogous wording to the questions about inflation expectations. As you might guess, consumers lack perfect knowledge of inflation in the recent past. If you're like most people (which, by dent of reading an economic blog, you are probably not), you probably haven't looked up inflation statistics or read the financial news recently.
But more surprisingly, consumers seem just as uncertain about past inflation, or even more so, as about future inflation. Take a look at these histograms of inflation perceptions and expectations from the February 2016 survey data:
Compare Panel A to Panel C. Panel A shows consumers' perceptions of inflation over the past 5- to 10-years, and Panel C shows their expectations for the next 5- to 10-years. Both panels show a great deal of dispersion, or variation across consumers. But also notice the response heaping at multiples of 5%. In both panels, over 10% of respondents choose 5%, and you also see more 10% responses than either 9% or 11% responses. In a working paper, I show that this response heaping is indicative of high uncertainty. Consumers choose a 5%, 10%, 15%, etc. response to indicate high imprecision in their estimates of future inflation. So it is quite surprising that even more consumers choose the 10, 15, 20, and 25% responses for perceptions of past inflation than for expectations of future inflation.
The response heaping at multiples of 5% is also quite substantial for short-term inflation perceptions (Panel B). Without access to the underlying data, I can't tell for sure whether it is more or less prevalent than for expectations of future short-term inflation, but it is certainly noticeable.
What does this tell us? People are just as unsure about inflation in the relatively recent past as they are about inflation in the near to medium-run future. And this says something important for monetary policymakers. A goal of the Federal Reserve is to anchor medium- to long-run inflation expectations at the 2% target. With strongly-anchored expectations, we should see most expectations near 2% with low uncertainty. If people are uncertain about longer-run inflation, it could either be that they are unaware of the Fed's inflation target, or aware but unconvinced that the Fed will actually achieve its target. It is difficult to say which is the case. The former would imply that we need more public informedness about economic concepts and the Fed, while the latter would imply that the Fed needs to improve its credibility among an already-informed public. Since perceptions are about as uncertain as expectations, this lends support to the idea that people are simply uninformed about inflation-- or that memory of economic statistics is relatively poor.
In many macroeconomic models, inflation perceptions should be nearly perfect. After all, inflation statistics are publicly available, and anyone should be able to access them. The Federal Reserve commissioned the Michigan Survey of Consumers Research Center to survey consumers about their perceptions of inflation over the past year and over the past 5- to 10-years, using analogous wording to the questions about inflation expectations. As you might guess, consumers lack perfect knowledge of inflation in the recent past. If you're like most people (which, by dent of reading an economic blog, you are probably not), you probably haven't looked up inflation statistics or read the financial news recently.
But more surprisingly, consumers seem just as uncertain about past inflation, or even more so, as about future inflation. Take a look at these histograms of inflation perceptions and expectations from the February 2016 survey data:
Source: December 5 FEDS Note |
Compare Panel A to Panel C. Panel A shows consumers' perceptions of inflation over the past 5- to 10-years, and Panel C shows their expectations for the next 5- to 10-years. Both panels show a great deal of dispersion, or variation across consumers. But also notice the response heaping at multiples of 5%. In both panels, over 10% of respondents choose 5%, and you also see more 10% responses than either 9% or 11% responses. In a working paper, I show that this response heaping is indicative of high uncertainty. Consumers choose a 5%, 10%, 15%, etc. response to indicate high imprecision in their estimates of future inflation. So it is quite surprising that even more consumers choose the 10, 15, 20, and 25% responses for perceptions of past inflation than for expectations of future inflation.
The response heaping at multiples of 5% is also quite substantial for short-term inflation perceptions (Panel B). Without access to the underlying data, I can't tell for sure whether it is more or less prevalent than for expectations of future short-term inflation, but it is certainly noticeable.
What does this tell us? People are just as unsure about inflation in the relatively recent past as they are about inflation in the near to medium-run future. And this says something important for monetary policymakers. A goal of the Federal Reserve is to anchor medium- to long-run inflation expectations at the 2% target. With strongly-anchored expectations, we should see most expectations near 2% with low uncertainty. If people are uncertain about longer-run inflation, it could either be that they are unaware of the Fed's inflation target, or aware but unconvinced that the Fed will actually achieve its target. It is difficult to say which is the case. The former would imply that we need more public informedness about economic concepts and the Fed, while the latter would imply that the Fed needs to improve its credibility among an already-informed public. Since perceptions are about as uncertain as expectations, this lends support to the idea that people are simply uninformed about inflation-- or that memory of economic statistics is relatively poor.
Tuesday, September 27, 2016
Why are Long-Run Inflation Expectations Falling?
Randal Verbrugge and I have just published a Federal Reserve Bank of Cleveland Economic Commentary called "Digging into the Downward Trend in Consumer Inflation Expectations." The piece focuses on long-run inflation expectations--expectations for the next 5 to 10 years-- from the Michigan Survey of Consumers. These expectations have been trending downward since the summer of 2014, around the same time as oil and gas prices started to decline. It might seem natural to conclude that falling gas prices are responsible for the decline in long-run inflation expectations. But we suggest that this may not be the whole story.
First of all, gas prices have exhibited two upward surges since 2014, neither of which was associated with a rise in long-run inflation expectations. Second, the correlation between gas prices and inflation expectations (a relationship I explore in much more detail in this working paper) appears too weak to explain the size of the decline. So what else could be going on?
If you look at the histogram in Figure 2, below, you can see the distribution of inflation forecasts that consumers give in three different time periods: an early period, the first half of 2014, and the past year. The shaded gray bars correspond to the early period, the red bars to 2014, and the blue bars to the most recent period. Notice that there is some degree of "response heaping" at multiples of 5%. In another paper, I use this response heaping to help quantify consumers' uncertainty about long-run inflation. The idea is that people who are more uncertain about inflation, or have a less precise estimate of what it should be, tend to report a round number-- this is a well-documented tendency in how people communicate imprecision.
The response heaping has declined over time, corresponding to a fall in my consumer inflation uncertainty index for the longer horizon. As we detail in the Commentary, this fall in uncertainty helps explain the decline in the measured median inflation forecast. This is a remnant of the fact that common round forecasts, 5% and 10%, are higher than common non-round forecasts.
There is also a notable change in the distribution of non-round forecasts over time. The biggest change is that 1% forecasts for long-run inflation are much more common than previously (see how the blue bar is higher than the red and gray bars for 1% inflation). I think this is an important sign that some consumers (probably those that are more informed about the economy and inflation) are noticing that inflation has been quite low for an extended period, and are starting to incorporate low inflation into their long-run expectations. More consumers expect 1% inflation than 2%.
Tuesday, August 16, 2016
More Support for a Higher Inflation Target
Ever since the FOMC announcement in 2012 that 2% PCE inflation is consistent with the Fed's price stability mandate, economists have questioned whether the 2% target is optimal. In 2013, for example, Laurence Ball made the case for a 4% target. Two new NBER working papers out this week each approach the topic of the optimal inflation target from different angles. Both, I think, can be interpreted as supportive of a somewhat higher target-- or at least of the idea that moderately higher inflation has greater benefits and smaller costs than conventionally believed.
The first, by Marc Dordal-i-Carreras, Olivier Coibion, Yuriy Gorodnichenko, and Johannes Wieland, is called "Infrequent but Long-Lived Zero-Bound Episodes and the Optimal Rate of Inflation." One benefit of a higher inflation target is to reduce the occurrence of zero lower bound (ZLB) episodes, so understanding the welfare costs of these episodes is important in calculating an optimal inflation target. The authors explain that in standard models with a ZLB, normally-distributed shocks result in short-lived ZLB episodes. This is in contrast with the reality of frequent but long-lived ZLB episodes. They build models that can generate long-lived ZLB episodes and show that welfare costs of ZLB episodes increase steeply with duration; 8 successive quarters at the ZLB is costlier than two separate 4-quarter episodes.
If ZLB episodes are costlier, it makes sense to have a higher inflation target to reduce their frequency. The authors note, however, that the estimate of the optimal target implied by their models are very sensitive to modeling assumptions and calibration:
Empirical evidence of inefficient price dispersion is sparse, since there is relatively minimal fluctuation in inflation in the past few decades, when BLS microdata on consumer prices is available. Nakamura et al. undertook the arduous task of extending the BLS microdataset back to 1977, encompassing higher-inflation episodes. Calculating price dispersion within a category of goods can be problematic, because price dispersion may arise from differences in quality or features of the goods. The authors instead look at the absolute size of price changes, explaining, "Intuitively, if inflation leads prices to drift further away from their optimal level, we should see prices adjusting by larger amounts when they adjust. The absolute size of price adjustments should reveal how far away from optimal the adjusting prices had become before they were adjusted. The absolute size of price adjustment should therefore be highly informative about inefficient price dispersion."
They find that the mean absolute size of price changes is fairly constant from 1977 to the present, and conclude that "There is, thus, no evidence that prices deviated more from their optimal level during the Great Inflation period when inflation was running at higher than 10% per year than during the more recent period when inflation has been close to 2% per year. We conclude from this that the main costs of inflation in the New Keynesian model are completely elusive in the data. This implies that the strong conclusions about optimality of low inflation rates reached by researchers using models of this kind need to be reassessed."
The first, by Marc Dordal-i-Carreras, Olivier Coibion, Yuriy Gorodnichenko, and Johannes Wieland, is called "Infrequent but Long-Lived Zero-Bound Episodes and the Optimal Rate of Inflation." One benefit of a higher inflation target is to reduce the occurrence of zero lower bound (ZLB) episodes, so understanding the welfare costs of these episodes is important in calculating an optimal inflation target. The authors explain that in standard models with a ZLB, normally-distributed shocks result in short-lived ZLB episodes. This is in contrast with the reality of frequent but long-lived ZLB episodes. They build models that can generate long-lived ZLB episodes and show that welfare costs of ZLB episodes increase steeply with duration; 8 successive quarters at the ZLB is costlier than two separate 4-quarter episodes.
If ZLB episodes are costlier, it makes sense to have a higher inflation target to reduce their frequency. The authors note, however, that the estimate of the optimal target implied by their models are very sensitive to modeling assumptions and calibration:
"We find that depending on our calibration of the average duration and the unconditional frequency of ZLB episodes, the optimal inflation rate can range from 1.5% to 4%. This uncertainty stems ultimately from the paucity of historical experience with ZLB episodes, which makes pinning down these parameters with any degree of confidence very difficult. A key conclusion of the paper is therefore that much humility is called for when making recommendations about the optimal rate of inflation since this fundamental data constraint is unlikely to be relaxed anytime soon."The second paper, by Emi Nakamura, Jón Steinsson, Patrick Sun, and Daniel Villar, is called "The Elusive Costs of Inflation: Price Dispersion during the U.S. Great Inflation." This paper notes that in standard New Keynesian models with Calvo pricing, one of the main welfare costs of inflation comes from inefficient price dispersion. When inflation is high, prices get further from optimal between price resets. This distorts the allocative role of prices, as relative prices no longer accurately reflect relative costs of production. In a standard New Keynesian model, the implied cost of this reduction in production efficiency is about 10% if you move from 0% inflation to 12% inflation. This is huge-- an order of magnitude greater than the welfare costs of business cycle fluctuations in output. This is why standard models recommend a very low inflation target.
Empirical evidence of inefficient price dispersion is sparse, since there is relatively minimal fluctuation in inflation in the past few decades, when BLS microdata on consumer prices is available. Nakamura et al. undertook the arduous task of extending the BLS microdataset back to 1977, encompassing higher-inflation episodes. Calculating price dispersion within a category of goods can be problematic, because price dispersion may arise from differences in quality or features of the goods. The authors instead look at the absolute size of price changes, explaining, "Intuitively, if inflation leads prices to drift further away from their optimal level, we should see prices adjusting by larger amounts when they adjust. The absolute size of price adjustments should reveal how far away from optimal the adjusting prices had become before they were adjusted. The absolute size of price adjustment should therefore be highly informative about inefficient price dispersion."
They find that the mean absolute size of price changes is fairly constant from 1977 to the present, and conclude that "There is, thus, no evidence that prices deviated more from their optimal level during the Great Inflation period when inflation was running at higher than 10% per year than during the more recent period when inflation has been close to 2% per year. We conclude from this that the main costs of inflation in the New Keynesian model are completely elusive in the data. This implies that the strong conclusions about optimality of low inflation rates reached by researchers using models of this kind need to be reassessed."
Thursday, July 21, 2016
Inflation Uncertainty Update and Rise in Below-Target Inflation Expectations
In my working paper "Measuring Uncertainty Based on Rounding: New Method and Application to Inflation Expectations," I develop a new measure of consumers' uncertainty about future inflation. The measure is based on a well-documented tendency of people to use round numbers to convey uncertainty or imprecision across a wide variety of contexts. As I detail in the paper, a strikingly large share of respondents on the Michigan Survey of Consumers report inflation expectations that are a multiple of 5%. I exploits variation over time in the distribution of survey responses (in particular, the amount of "response heaping" around multiples of 5) to create inflation uncertainty indices for the one-year and five-to-ten-year horizons.
As new Michigan Survey data becomes available, I have been updating the indices and posting them here. I previously blogged about the update through November 2015. Now that a few more months of data are publicly available, I have updated the indices through June 2016. Figure 1, below, shows the updated indices. Figure 2 zooms in on more recent years and smooths with a moving average filter. You can see that short-horizon uncertainty has been falling since its historical high point in the Great Recession, and long-horizon uncertainty has been at an historical low.
The change in response patterns from 2015 to 2016 is quite interesting. Figure 3 shows histograms of the short-horizon inflation expectation responses given in 2015 and in the first half of 2016. The brown bars show the share of respondents in 2015 who gave each response, and the black lines show the share in 2016. For both years, heaping at multiples of 5 is apparent when you observe the spikes at 5 (but not 4 or 6) and at 10 (but not 9 or 11). However, it is less sharp than in other years when the uncertainty index was higher. But also notice that in 2016, the share of 0% and 1% responses rose and the share of 2, 3, 4, 5, and 10% responses fell relative to 2015.
Some respondents take the survey twice with a 6-month gap, so we can see how people switch their responses. Of the respondents who chose a 2% forecast in the second half of 2015 (those who were possible aware of the 2% target), 18% switched to a 0% forecast and 24% switched to a 1% forecast when they took the survey again in 2016. The rise in 1% responses seems most noteworthy to me-- are people finally starting to notice slightly-below-target inflation and incorporate it into their expectations? I think it's too early to say, but worth tracking.
As new Michigan Survey data becomes available, I have been updating the indices and posting them here. I previously blogged about the update through November 2015. Now that a few more months of data are publicly available, I have updated the indices through June 2016. Figure 1, below, shows the updated indices. Figure 2 zooms in on more recent years and smooths with a moving average filter. You can see that short-horizon uncertainty has been falling since its historical high point in the Great Recession, and long-horizon uncertainty has been at an historical low.
![]() |
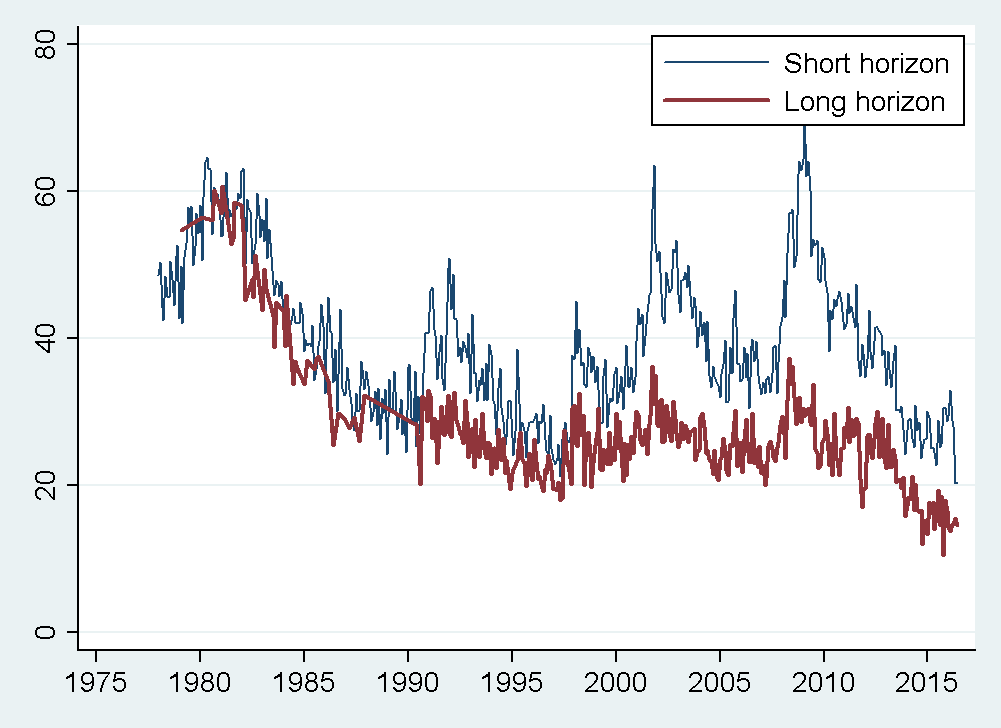
Figure 1: Consumer inflation uncertainty index developed in Binder (2015) using data from the University of Michigan Survey of Consumers. To download updated data, visit https://sites.google.com/site/inflationuncertainty/. |
![]() |
Figure 2: Consumer inflation uncertainty index (centered 3-month moving average) developed in Binder (2015) using data from the University of Michigan Survey of Consumers. To download updated data, visit https://sites.google.com/site/inflationuncertainty/. |
The change in response patterns from 2015 to 2016 is quite interesting. Figure 3 shows histograms of the short-horizon inflation expectation responses given in 2015 and in the first half of 2016. The brown bars show the share of respondents in 2015 who gave each response, and the black lines show the share in 2016. For both years, heaping at multiples of 5 is apparent when you observe the spikes at 5 (but not 4 or 6) and at 10 (but not 9 or 11). However, it is less sharp than in other years when the uncertainty index was higher. But also notice that in 2016, the share of 0% and 1% responses rose and the share of 2, 3, 4, 5, and 10% responses fell relative to 2015.
Some respondents take the survey twice with a 6-month gap, so we can see how people switch their responses. Of the respondents who chose a 2% forecast in the second half of 2015 (those who were possible aware of the 2% target), 18% switched to a 0% forecast and 24% switched to a 1% forecast when they took the survey again in 2016. The rise in 1% responses seems most noteworthy to me-- are people finally starting to notice slightly-below-target inflation and incorporate it into their expectations? I think it's too early to say, but worth tracking.
![]() |
Figure 3: Created by Binder with data from University of Michigan Survey of Consumers |
Wednesday, July 6, 2016
Estimation of Historical Inflation Expectations
The final version of my paper "Estimation of Historical Inflation Expectations" is now available online in the journal Explorations in Economic History. (Ungated version here.)
My paper grew out of a chapter in my dissertation. I was interested in inflation expectations in the Great Depression after serving as a discussant for a paper by Andy Jalil and Gisela Rua on "Inflation Expectations and Recovery from the Depression in 1933:Evidence from the Narrative Record." I also remember being struck by Christina Romer and David Romer's, (2013, p. 68) remark that a whole “cottage industry” of research in the 1990s was devoted to the question of whether the deflation of 1930-32 was anticipated.
I found it interesting to think about why different papers came to different estimates of inflation expectations in the Great Depression by examining the methodological issues around estimating expectations when direct survey or market measures are not available. I later broadened the paper to consider the range of estimates of inflation expectations in the classical gold standard era and the hyperinflations of the 1920s.
A lot of my research focuses on contemporary inflation expectations, mostly using survey-based measures. Some of the issues that arise in characterizing historical expectations are still relevant even when survey or market-based measures of inflation expectations are readily available--issues of noise, heterogeneity, uncertainty, time-varying risk premia, etc. I hope this piece will also be useful to people interested in current inflation expectations in parts of the world where survey data is unreliable or nonexistent, or where markets in inflation-linked assets are underdeveloped.
What I enjoyed most about writing this paper was trying to determine and formalize the assumptions that various authors used to form their estimates, even when these assumptions weren't laid out explicitly. I also enjoyed conducting my first meta-analysis (thanks to the recommendation of the referee and editor.) I found T. D. Stanley's JEL article on meta-analysis to be a useful guide.
Abstract: Expected inflation is a central variable in economic theory. Economic historians have estimated historical inflation expectations for a variety of purposes, including studies of the Fisher effect, the debt deflation hypothesis, central bank credibility, and expectations formation. I survey the statistical, narrative, and market-based approaches that have been used to estimate inflation expectations in historical eras, including the classical gold standard era, the hyperinflations of the 1920s, and the Great Depression, highlighting key methodological considerations and identifying areas that warrant further research. A meta-analysis of inflation expectations at the onset of the Great Depression reveals that the deflation of the early 1930s was mostly unanticipated, supporting the debt deflation hypothesis, and shows how these results are sensitive to estimation methodology.This paper is part of a new "Surveys and Speculations" feature in Explorations in Economic History. Recent volumes of the journal open with a Surveys and Speculations article, where "The idea is to combine the style of JEL [Journal of Economic Literature] articles with the more speculative ideas that one might put in a book – producing surveys that can help to guide future research. The emphasis can either be on the survey or the speculation part." Other examples include "What we can learn from the early history of sovereign debt" by David Stasavage, "Urbanization without growth in historical perspective" by Remi Jedwab and Dietrich Vollrath, and "Surnames: A new source for the history of social mobility" by Gregory Clark, Neil Cummins, Yu Hao, and Dan Diaz Vidal. The referee and editorial reports were extremely helpful, so I really recommend this if you're looking for an outlet for a JEL-style paper with economic history relevance.
My paper grew out of a chapter in my dissertation. I was interested in inflation expectations in the Great Depression after serving as a discussant for a paper by Andy Jalil and Gisela Rua on "Inflation Expectations and Recovery from the Depression in 1933:Evidence from the Narrative Record." I also remember being struck by Christina Romer and David Romer's, (2013, p. 68) remark that a whole “cottage industry” of research in the 1990s was devoted to the question of whether the deflation of 1930-32 was anticipated.
I found it interesting to think about why different papers came to different estimates of inflation expectations in the Great Depression by examining the methodological issues around estimating expectations when direct survey or market measures are not available. I later broadened the paper to consider the range of estimates of inflation expectations in the classical gold standard era and the hyperinflations of the 1920s.
A lot of my research focuses on contemporary inflation expectations, mostly using survey-based measures. Some of the issues that arise in characterizing historical expectations are still relevant even when survey or market-based measures of inflation expectations are readily available--issues of noise, heterogeneity, uncertainty, time-varying risk premia, etc. I hope this piece will also be useful to people interested in current inflation expectations in parts of the world where survey data is unreliable or nonexistent, or where markets in inflation-linked assets are underdeveloped.
What I enjoyed most about writing this paper was trying to determine and formalize the assumptions that various authors used to form their estimates, even when these assumptions weren't laid out explicitly. I also enjoyed conducting my first meta-analysis (thanks to the recommendation of the referee and editor.) I found T. D. Stanley's JEL article on meta-analysis to be a useful guide.
Friday, June 17, 2016
The St. Louis Fed's Regime-Based Approach
St. Louis Federal Reserve President James Bullard today presented “The St. Louis Fed’s New Characterization of the Outlook for the U.S. Economy.” This is a change in how the St. Louis Fed thinks about medium- and longer-term macroeconomic outcomes and makes recommendations for the policy path.
As an example of why using this regime-based forecasting approach matters, imagine that the economy is in a low productivity growth regime in which the long-run growth rate is 2%, and that under a high productivity growth regime, the long-run growth rate would be 4%. Suppose you are trying to forecast the growth rate a year from now. One approach would be to come up with an estimate of the probability P that the economy will have switched to the high productivity regime, then estimate a growth rate of G1=(1-P)*2%+P*4%. An alternative is to assume that the economy will stay in its current regime, in which case your estimate is G2=2%<G1, and the chance that the economy switches regime is an “upside risk” to your forecast. This second approach is more like what the St. Louis Fed is doing. Think of it as taking the mode instead of the expected value (mean) of the probability distribution over future growth. They are making their forecasts based on the most likely outcome, not the weighted average of the different outcomes.
In a robust-control inspired approach, the possibility of switching into a recession state (and hitting the zero lower bound again) would get weighted pretty heavily in determination of the policy path, because even if it is unlikely, it would be really bad. What would that look like? This gets a little tricky because the "fundamentals" characterizing these regimes are not all fundamental in the sense of being exogenous to monetary policy. In particular, whether and when the economy enters another recession depends on the path of the policy rate. So too, indirectly, does the real rate of return on short-term government debt, both through liquidity premia and through expected inflation if we get back to the ZLB.
“The hallmark of the new narrative is to think of medium- and longer-term macroeconomic outcomes in terms of regimes. The concept of a single, long-run steady state to which the economy is converging is abandoned, and is replaced by a set of possible regimes that the economy may visit. Regimes are generally viewed as persistent, and optimal monetary policy is viewed as regime dependent. Switches between regimes are viewed as not forecastable.”Bullard describes three “fundamentals” that characterize which regime the economy is in: productivity growth (high or low), the real return on short-term government debt (high or low), and state of the business cycle (recession or not). We are currently in a low-productivity growth, low rate, no-recession regime. The St. Louis Fed’s forecasts for the next 2.5 years are made with the assumption that we will stay in such a regime over the forecast horizon. They forecast real output growth of 2%, 4.7% unemployment, and 2% trimmed-mean PCE inflation.
As an example of why using this regime-based forecasting approach matters, imagine that the economy is in a low productivity growth regime in which the long-run growth rate is 2%, and that under a high productivity growth regime, the long-run growth rate would be 4%. Suppose you are trying to forecast the growth rate a year from now. One approach would be to come up with an estimate of the probability P that the economy will have switched to the high productivity regime, then estimate a growth rate of G1=(1-P)*2%+P*4%. An alternative is to assume that the economy will stay in its current regime, in which case your estimate is G2=2%<G1, and the chance that the economy switches regime is an “upside risk” to your forecast. This second approach is more like what the St. Louis Fed is doing. Think of it as taking the mode instead of the expected value (mean) of the probability distribution over future growth. They are making their forecasts based on the most likely outcome, not the weighted average of the different outcomes.
Bullard claims that P is quite small, i.e. regimes are persistent, and that regime changes are unforecastable. He therefore argues that "the best that we can do today is to forecast that the current regime will persist and set policy appropriately for this regime." The policy takeaway is that “In light of this new approach and the associated forecast, the appropriate regime-dependent policy rate path is 63 basis points over the forecast horizon.”
The approach of forecasting that the current regime will persist and setting policy appropriately for the current regime is an interesting contrast to the "robust control" literature. As Richard Dennis summarizes, "rather than focusing on the 'most likely' outcome or on the average outcome, robust control argues that policymakers should focus on and defend against the worst-case outcome." He adds:
"In an interesting application of robust control methods, Sargent (1999) studies a simple macro-policy model and shows that robustness, in the “robust control” sense, does not necessarily lead to policy attenuation. Instead, the robust policy rule may respond more aggressively to shocks. The intuition for this result is that, by pursuing a more aggressive policy, the central bank can prevent the economy from encountering situations where model misspecification might be especially damaging."In Bullard's Figure 1 (below), we see the baseline forecast corresponding to continuation in the no recession, low real rate of return, low productivity growth regime. We also see some of the upside risks to the policy rate path, corresponding to switches to high real rate of return and/or high productivity growth regimes. We also see the arrow pointing to recession, but the four possible outcomes associated with that switch are omitted from the diagram. Bullard writes that "We are currently in a no recession state, but it is possible that we could switch to a recession state. If such a switch occurred, all variables would be affected but most notably, the unemployment rate would rise substantially. Again, the possibility of such a switch does not enter directly into the forecast because we have no reason to forecast a recession given the data available today. The possibility of recession is instead a risk to the forecast."
In a robust-control inspired approach, the possibility of switching into a recession state (and hitting the zero lower bound again) would get weighted pretty heavily in determination of the policy path, because even if it is unlikely, it would be really bad. What would that look like? This gets a little tricky because the "fundamentals" characterizing these regimes are not all fundamental in the sense of being exogenous to monetary policy. In particular, whether and when the economy enters another recession depends on the path of the policy rate. So too, indirectly, does the real rate of return on short-term government debt, both through liquidity premia and through expected inflation if we get back to the ZLB.
Wednesday, January 27, 2016
Downside Inflation Risk
Earlier this month, New York Federal Reserve President William Dudley gave a speech on "The U.S. Economic Outlook and Implications for Monetary Policy." Like other Fed officials, Dudley expressed concern about falling inflation expectations:
The 22 basis-points decline in 3-year inflation expectations that Dudley referred to is the median for all consumers. If you look at the table below, the decline is more than twice as large for consumers with income above $50,000 per year.
This might be important since high-income consumers' expectations appear to be a stronger driver of actual inflation dynamics than the median consumer's expectations, probably because they are a better proxy for price-setters' expectations. These higher-income consumers' inflation expectations were at or above 3% from the start of the survey in 2013 through mid-2014, and are now at their lowest recorded level. Lower-income consumers' expectations have risen slightly from a low of 2.72% in September 2015. We need a few more months of data to separate trend from noise, but if anything this should strengthen Dudley's concern about downside risks to inflation.
With respect to the risks to the inflation outlook, the most concerning is the possibility that inflation expectations become unanchored to the downside. This would be problematic were it to occur because inflation expectations are an important driver of actual inflation. If inflation expectations become unanchored to the downside, it would become much more difficult to push inflation back up to the central bank’s objective.Dudley, perhaps because of his New York Fed affiliation, pointed to the New York Fed’s Survey of Consumer Expectations as his preferred indicator of inflation expectations. He noted that on this survey, "The median of 3-year inflation expectations has declined over the past year, falling by 22 basis points to 2.8 percent. While the magnitude of this decline is small, I think it is noteworthy because the current reading is below where we have been during the survey history."
The 22 basis-points decline in 3-year inflation expectations that Dudley referred to is the median for all consumers. If you look at the table below, the decline is more than twice as large for consumers with income above $50,000 per year.
Source: Data from Survey of Consumer Expectations, © 2013-2015 Federal Reserve Bank of New York (FRBNY). Calculations by Carola Binder. |
Sunday, January 10, 2016
Household Inflation Uncertainty Update
In my job market paper last year, I constructed a new measure of households' inflation uncertainty based on people's tendency to use round numbers when they report their inflation expectations on the Michigan Survey of Consumers. The monthly consumer inflation uncertainty index is available at a short horizon (one-year-ahead) and a long horizon (five-to-ten-years ahead). I explain the construction of the indices in more detail, and update them periodically, at the Inflation Uncertainty website, where you can also download the indices.
I recently updated the indices through November 2015. As the figure below shows, short-horizon inflation uncertainty reached a historical maximum in February 2009, but has since fallen and remained relatively steady in the last two years. Consumers are less uncertain about longer-run than shorter- run inflation since around 1990. This makes sense if at least some consumers have anchored expectations, i.e. they are fairly certain about what will happen with inflation over the longer run, even if they expect it to fluctuate in the shorter run.

In my paper, I interpreted the decline of long-run consumer inflation uncertainty over the 1980s as a result of improved anchoring during and following the Volcker disinflation, but noted the apparent lack of improvement since the mid-90s, despite the Fed's efforts to improve its communication strategy and better anchor expectations. With an extra year of data, it looks like long-run inflation uncertainty may have actually declined, if only slightly, in the last few years. Still, that doesn't mean that consumers' expectations are strongly anchored, as I show in another working paper (which Kumar et al. follow up for New Zealand with similar results).
Monday, September 21, 2015
Whose Expectations Augment the Phillips Curve?
My first economics journal publication is now available online in Economics Letters. This link provides free access until November 9, 2015. It is a brief piece (hence the letter format) titled "Whose Expectations Augment the Phillips Curve?" The short answer:
"The inflation expectations of high-income, college-educated, male, and working-age people play a larger role in inflation dynamics than do the expectations of other groups of consumers or of professional forecasters."Update: The permanent link to the paper is here.
Sunday, September 6, 2015
Which Measure of Inflation Should a Central Bank Target?
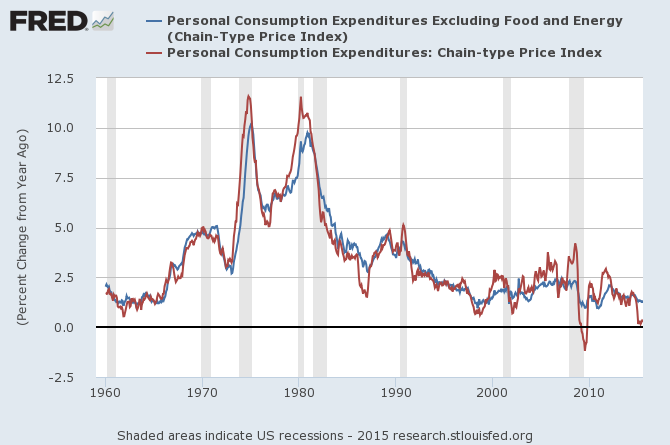
"Various monetary proposals can be viewed as inflation targeting with a nonstandard price index: The gold standard uses only the price of gold, and a fixed exchange rate uses only the price of a foreign currency."That's from a 2003 paper by Greg Mankiw and Ricardo Reis called "What Measure of Inflation Should a Central Bank Target?" At the time, the Federal Reserve had not explicitly announced its inflation target, though an emphasis on core inflation, which excludes volatile food and energy prices (the blue line in the figure below), arose under Alan Greenspan's chairmanship. Other central banks, including the Bank of England and the European Central Bank, instead focus on headline inflation. In 2012, the Fed formalized PCE inflation as its price stability target, but closely monitors core inflation as a key indicator of underlying inflation trends.. Some at the Fed, including St. Louis Fed President James Bullard, have argued that the Fed should focus more on headline inflation (the red line) and less on core inflation (the blue line).
![]() |
Source: FRED |
In particular, they suppose the central bank's objective is to minimize the volatility of the output gap. They explain, "We are interested in finding the price index that, if kept on an assigned target, would lead to the greatest stability in economic activity. This concept might be called the stability price index." They model how the weight on each sector in this stability price index depend on certain sectoral properties: the cyclical sensitivity of the sector, the proclivity of the sector to experience idiosyncratic shocks, and the speed with which the prices in the sector can adjust.
The findings are mostly intuitive. If a particular sector's prices are very procyclical, do not experience large idiosyncratic shocks, or are very sticky, that sector should receive relatively large weight in the stability price index. Each of these characteristics makes the sector more useful from a signal-extraction perspective as an indicator of economic activity.
Next, Mankiw and Reis do a "back-of-the-envelop" exercise to calculate the weights for a stability price index for the United States using data from 1957 to 2001. They consider four sectors: food, energy, other goods and services, and nominal wages. They stick to four sectors for simplicity, but it would also be possible to include other prices, like gold and other asset prices. To the extent that these are relatively flexible and volatile, they would probably receive little weight. The inclusion of nominal wages is interesting, because it is a price of labor, not of a consumption good, so it gets a weight of 0 in the consumer price index. But nominal wages are procyclical, not prone to indiosyncratic shocks, and sticky, so the result is that the stability price index weight on nominal wages is near one, while the other sectors get weights near zero. This finding is in line with other results, even derived from very different models, about the optimality of including nominal wages in the monetary policy target.
More recently, Josh Bivens and others have proposed nominal wage targets for monetary policy, but they frame this as an alternative to unemployment as an indicator of labor market slack for the full employment component of the Fed's mandate. In Mankiw and Reis' paper, even a strict inflation targeting central bank with no full employment goal may want to use nominal wages as a big part of its preferred measure of inflation. (Since productivity
If we leave nominal wages out of the picture, the results provide some justification for a focus on core, rather than headline, inflation. Namely, food and energy prices are very volatile and not very sticky. Note, however, that the paper assumes that the central bank has perfect credibility, and can thus achieve whatever inflation target it commits to. In Bullard's argument against a focus on core inflation, he implicitly challenges this assumption:
"One immediate benefit of dropping the emphasis on core inflation would be to reconnect the Fed with households and businesses who know price changes when they see them. With trips to the gas station and the grocery store being some of the most frequent shopping experiences for many Americans, it is hardly helpful for Fed credibility to appear to exclude all those prices from consideration in the formation of monetary policy."Bullard's concern is that since food and energy prices are so visible and salient for consumers, they might play an oversized role in perceptions and expectations of inflation. If the Fed holds core inflation steady while gas prices and headline inflation rise, maybe inflation expectations will rise a lot, becoming unanchored, and causing feedback into core inflation. There is mixed evidence on whether this is a real concern in recent years. I'm doing some work on this topic myself, and hope to share results soon.
As an aside to my students in Senior Research Seminar, I highly recommend the Mankiw and Reis paper as an example of how to write well, especially if you plan to do a theoretical thesis.
Note: The description of the Federal Reserve's inflation target in the first paragraph of this post was edited for accuracy on September 25.
Tuesday, June 16, 2015
Wage Increases Do Not Signal Impending Inflation
When the FOMC meets over the next two days, they will surely be looking for signs of impending inflation. Even though actual inflation is below target, any hint that pressure is building will be seized upon by more hawkish committee members as impetus for an earlier rate rise. The relatively strong May jobs report and uptick in nominal wage inflation are likely to draw attention in this respect.
Hopefully the FOMC members are aware of new research by two of the Fed's own economists, Ekaterina Peneva and Jeremy Rudd, on the passthrough (or lack thereof) of labor costs to price inflation. The research, which fails to find an important role for labor costs in driving inflation movements, casts doubts on wage-based explanations of inflation dynamics in recent years. They conclude that "price inflation now responds less persistently to changes in real activity or costs; at the same time, the joint dynamics of inflation and compensation no longer manifest the type of wage–price spiral that was evident in earlier decades."
Peneva and Rudd use a time-varying parameter/stochastic volatility VAR framework which lets them see how core inflation responds to a shock to the growth rate of labor costs at different times. The figure below shows how the response has varied over the past few decades. In 1975 and 1985, a rise in labor cost growth was followed by a rise in core inflation, but in recent decades, both before and after the Great Recession, there is no such response:
Peneva and Rudd do not take a strong stance on why wage-price dynamics appear to have changed. But their findings do complement research from Yash Mehra in 2000, who suggests that "One problem with this popular 'cost-push' view of the inflation process
is that it does not recognize the influences of Federal Reserve policy and the
resulting inflation environment on determining the causal influence of wage
growth on inflation. If the Fed follows a non-accommodative monetary policy
and keeps inflation low, then firms may not be able to pass along excessive
wage gains in the form of higher product prices." Mehra finds that "Wage growth no longer helps predict inflation if we consider subperiods
that begin in the early 1980s...The period
since the early 1980s is the period during which the Fed has concentrated on
keeping inflation low. What is new here is the finding that even in the pre-
1980 period there is another subperiod, 1953Q1 to 1965Q4, during which
wage growth does not help predict inflation. This is also the subperiod during
which inflation remained mostly low, mainly due to monetary policy pursued
by the Fed."
Peneva and Rudd use a time-varying parameter/stochastic volatility VAR framework which lets them see how core inflation responds to a shock to the growth rate of labor costs at different times. The figure below shows how the response has varied over the past few decades. In 1975 and 1985, a rise in labor cost growth was followed by a rise in core inflation, but in recent decades, both before and after the Great Recession, there is no such response:
Subscribe to:
Posts (Atom)