Showing posts with label expectations. Show all posts

Thursday, December 7, 2017

Consumer Inflation Uncertainty Holding Steady

I recently updated my Consumer Inflation Uncertainty Index through October 2017. Data is available here and the official (gated) publication in the Journal of Monetary Economics is here. Inflation uncertainty remains low by historic standards. Uncertainty about longer-run (5- to 10-year ahead) inflation remains lower than uncertainty about next-year inflation.


In recent months, there has been no notable change in inflation uncertainty at either horizon.


The average "less uncertain" type consumer still expects longer-run inflation around 2.4%, while the longer-run inflation forecasts of "highly uncertain" consumers have risen in recent months to the 8-10% range.

Thursday, September 28, 2017

An Inflation Expectations Experiment

Last semester, my senior thesis advisee Alex Rodrigue conducted a survey-based information experiment via Amazon Mechanical Turk. We have coauthored a working paper detailing the experiment and results titled "Household Informedness and Long-Run Inflation Expectations: Experimental Evidence." I presented our research at my department seminar yesterday with the twin babies in tow, and my tweet about the experience is by far my most popular to date:

Consumers' inflation expectations are very disperse; on household surveys, many people report long-run inflation expectations that are far from the Fed's 2% target. Are these people unaware of the target, or do they know it but remain unconvinced of its credibility? In another paper in the Journal of Macroeconomics, I provide some non-experimental evidence that public knowledge of the Fed and its objectives is quite limited. In this paper, we directly treat respondents with information about the target and about past inflation, in randomized order, and see how they revise their reported long-run inflation expectations. We also collect some information about their prior knowledge of the Fed and the target, their self-reported understanding of inflation, and their numeracy and demographic characteristics. About a quarter of respondents knew the Fed's target and two-thirds could identify Yellen as Fed Chair from a list of three options.

As shown in the figure above, before receiving the treatments, very few respondents forecast 2% inflation over the long-run and only about a third even forecast in the 1-3% range. Over half report a multiple-of-5% forecast, which, as I argue in a recent paper in the Journal of Monetary Economics, is a likely sign of high uncertainty. When presented with a graph of the past 15 years of inflation, or with the FOMC statement announcing the 2% target, the average respondent revises their forecast around 2 percentage points closer to the target. Uncertainty also declines.

The results are consistent with imperfect information models because the information treatments are publicly available, yet respondents still revise their expectations after the treatments. Low informedness is part of the reason why expectations are far from the target. The results are also consistent with Bayesian updating, in the sense that high prior uncertainty is associated with larger revisions. But equally noteworthy is the fact that even after receiving both treatments, expectations are still quite heterogeneous and many still substantially depart from the target. So people seem to interpret the information in different ways and view it as imperfectly credible.

We look at how treatment effects vary by respondent characteristic. One interesting result is that, after receiving both treatments, the discrepancy between mean male and female inflation expectations (which has been noted in many studies) nearly disappears (see figure below).

There is more in the paper about how treatment effects vary with other characteristics, including respondents' opinion of government policy and their prior knowledge. We also look at whether expectations can be "un-anchored from below" with the graph treatment.


Thursday, September 14, 2017

Consumer Forecast Revisions: Is Information Really so Sticky?

My paper "Consumer Forecast Revisions: Is Information Really so Sticky?" was just accepted for publication in Economics Letters. This is a short paper that I believe makes an important point. 

Sticky information models are one way of modeling imperfect information. In these models, only a fraction (λ) of agents update their information sets each period. If λ is low, information is quite sticky, and that can have important implications for macroeconomic dynamics. There have been several empirical approaches to estimating λ. With micro-level survey data, a non-parametric and time-varying estimate of λ can be obtained by calculating the fraction of respondents who revise their forecasts (say, for inflation) at each survey date. Estimates from the Michigan Survey of Consumers (MSC) imply that consumers update their information about inflation approximately once every 8 months.

Here are two issues that I point out with these estimates:
I show that several issues with estimates of information stickiness based on consumer survey microdata lead to substantial underestimation of the frequency with which consumers update their expectations. The first issue stems from data frequency. The rotating panel of Michigan Survey of Consumer (MSC) respondents take the survey twice with a six-month gap. A consumer may have the same forecast at months t and t+ 6 but different forecasts in between. The second issue is that responses are reported to the nearest integer. A consumer may update her information, but if the update results in a sufficiently small revisions, it will appear that she has not updated her information. 
To quantify how these issues matter, I use data from the New York Fed Survey of Consumer Expectations, which is available monthly and not rounded to the nearest integer. I compute updating frequency with this data. It is very high-- at least 5 revisions in 8 months, as opposed to the 1 revision per 8 months found in previous literature.

Then I transform the data so that it is like the MSC data. First I round the responses to the nearest integer. This makes the updating frequency estimates decrease a little. Then I look at it at the six-month frequency instead of monthly. This makes the updating frequency estimates decrease a lot, and I find similar estimates to the previous literature-- updates about every 8 months.

So low-frequency data, and, to a lesser extent, rounded responses, result in large underestimates of revision frequency (or equivalently, overestimates of information stickiness). And if information is not really so sticky, then sticky information models may not be as good at explaining aggregate dynamics. Other classes of imperfect information models, or sticky information models combined with other classes of models, might be better.

Read the ungated version here. I will post a link to the official version when it is published.

Monday, December 5, 2016

The Future is Uncertain, but So Is the Past

In a recently-released research note, Federal Reserve Board economists Alan Detmeister, David Lebow, and Ekaterina Peneva summarize new survey results on consumers' inflation perceptions. The well-known Michigan Survey of Consumers asks consumers about their expectations of future inflation (over the next year and 5- to 10- years), but does not ask them what they believe inflation has been in recent years.

In many macroeconomic models, inflation perceptions should be nearly perfect. After all, inflation statistics are publicly available, and anyone should be able to access them. The Federal Reserve commissioned the Michigan Survey of Consumers Research Center to survey consumers about their perceptions of inflation over the past year and over the past 5- to 10-years, using analogous wording to the questions about inflation expectations. As you might guess, consumers lack perfect knowledge of inflation in the recent past. If you're like most people (which, by dent of reading an economic blog, you are probably not), you probably haven't looked up inflation statistics or read the financial news recently.

But more surprisingly, consumers seem just as uncertain about past inflation, or even more so, as about future inflation. Take a look at these histograms of inflation perceptions and expectations from the February 2016 survey data:

Source: December 5 FEDS Note

Compare Panel A to Panel C. Panel A shows consumers' perceptions of inflation over the past 5- to 10-years, and Panel C shows their expectations for the next 5- to 10-years. Both panels show a great deal of dispersion, or variation across consumers. But also notice the response heaping at multiples of 5%. In both panels, over 10% of respondents choose 5%, and you also see more 10% responses than either 9% or 11% responses. In a working paper, I show that this response heaping is indicative of high uncertainty. Consumers choose a 5%, 10%, 15%, etc. response to indicate high imprecision in their estimates of future inflation. So it is quite surprising that even more consumers choose the 10, 15, 20, and 25% responses for perceptions of past inflation than for expectations of future inflation.

The response heaping at multiples of 5% is also quite substantial for short-term inflation perceptions (Panel B). Without access to the underlying data, I can't tell for sure whether it is more or less prevalent than for expectations of future short-term inflation, but it is certainly noticeable.

What does this tell us? People are just as unsure about inflation in the relatively recent past as they are about inflation in the near to medium-run future. And this says something important for monetary policymakers. A goal of the Federal Reserve is to anchor medium- to long-run inflation expectations at the 2% target. With strongly-anchored expectations, we should see most expectations near 2% with low uncertainty. If people are uncertain about longer-run inflation, it could either be that they are unaware of the Fed's inflation target, or aware but unconvinced that the Fed will actually achieve its target. It is difficult to say which is the case. The former would imply that we need more public informedness about economic concepts and the Fed, while the latter would imply that the Fed needs to improve its credibility among an already-informed public. Since perceptions are about as uncertain as expectations, this lends support to the idea that people are simply uninformed about inflation-- or that memory of economic statistics is relatively poor.

Tuesday, September 27, 2016

Why are Long-Run Inflation Expectations Falling?

Randal Verbrugge and I have just published a Federal Reserve Bank of Cleveland Economic Commentary called "Digging into the Downward Trend in Consumer Inflation Expectations." The piece focuses on long-run inflation expectations--expectations for the next 5 to 10 years-- from the Michigan Survey of Consumers. These expectations have been trending downward since the summer of 2014, around the same time as oil and gas prices started to decline.  It might seem natural to conclude that falling gas prices are responsible for the decline in long-run inflation expectations. But we suggest that this may not be the whole story.

First of all, gas prices have exhibited two upward surges since 2014, neither of which was associated with a rise in long-run inflation expectations. Second, the correlation between gas prices and inflation expectations (a relationship I explore in much more detail in this working paper) appears too weak to explain the size of the decline. So what else could be going on?

If you look at the histogram in Figure 2, below, you can see the distribution of inflation forecasts that consumers give in three different time periods: an early period, the first half of 2014, and the past year. The shaded gray bars correspond to the early period, the red bars to 2014, and the blue bars to the most recent period. Notice that there is some degree of "response heaping" at multiples of 5%. In another paper, I use this response heaping to help quantify consumers' uncertainty about long-run inflation. The idea is that people who are more uncertain about inflation, or have a less precise estimate of what it should be, tend to report a round number-- this is a well-documented tendency in how people communicate imprecision.
The response heaping has declined over time, corresponding to a fall in my consumer inflation uncertainty index for the longer horizon. As we detail in the Commentary, this fall in uncertainty helps explain the decline in the measured median inflation forecast. This is a remnant of the fact that common round forecasts, 5% and 10%, are higher than common non-round forecasts.

There is also a notable change in the distribution of non-round forecasts over time. The biggest change is that 1% forecasts for long-run inflation are much more common than previously (see how the blue bar is higher than the red and gray bars for 1% inflation).  I think this is an important sign that some consumers (probably those that are more informed about the economy and inflation) are noticing that inflation has been quite low for an extended period, and are starting to incorporate low inflation into their long-run expectations. More consumers expect 1% inflation than 2%.

Wednesday, January 27, 2016

Downside Inflation Risk

Earlier this month, New York Federal Reserve President William Dudley gave a speech on "The U.S. Economic Outlook and Implications for Monetary Policy." Like other Fed officials, Dudley expressed concern about falling inflation expectations:
With respect to the risks to the inflation outlook, the most concerning is the possibility that inflation expectations become unanchored to the downside. This would be problematic were it to occur because inflation expectations are an important driver of actual inflation. If inflation expectations become unanchored to the downside, it would become much more difficult to push inflation back up to the central bank’s objective.
Dudley, perhaps because of his New York Fed affiliation, pointed to the New York Fed’s Survey of Consumer Expectations as his preferred indicator of inflation expectations. He noted that on this survey, "The median of 3-year inflation expectations has declined over the past year, falling by 22 basis points to 2.8 percent. While the magnitude of this decline is small, I think it is noteworthy because the current reading is below where we have been during the survey history."

The 22 basis-points decline in 3-year inflation expectations that Dudley referred to is the median for all consumers. If you look at the table below, the decline is more than twice as large for consumers with income above $50,000 per year.
Source: Data from Survey of Consumer Expectations, © 2013-2015 Federal Reserve Bank of New York (FRBNY). Calculations by Carola Binder.
This might be important since high-income consumers' expectations appear to be a stronger driver of actual inflation dynamics than the median consumer's expectations, probably because they are a better proxy for price-setters' expectations. These higher-income consumers' inflation expectations were at or above 3% from the start of the survey in 2013 through mid-2014, and are now at their lowest recorded level. Lower-income consumers' expectations have risen slightly from a low of 2.72% in September 2015. We need a few more months of data to separate trend from noise, but if anything this should strengthen Dudley's concern about downside risks to inflation.

Sunday, January 10, 2016

Household Inflation Uncertainty Update

In my job market paper last year, I constructed a new measure of households' inflation uncertainty based on people's tendency to use round numbers when they report their inflation expectations on the Michigan Survey of Consumers. The monthly consumer inflation uncertainty index is available at a short horizon (one-year-ahead) and a long horizon (five-to-ten-years ahead). I explain the construction of the indices in more detail, and update them periodically, at the Inflation Uncertainty website, where you can also download the indices.

I recently updated the indices through November 2015. As the figure below shows, short-horizon inflation uncertainty reached a historical maximum in February 2009, but has since fallen and remained relatively steady in the last two years. Consumers are less uncertain about longer-run than shorter- run inflation since around 1990. This makes sense if at least some consumers have anchored expectations, i.e. they are fairly certain about what will happen with inflation over the longer run, even if they expect it to fluctuate in the shorter run.


In my paper, I interpreted the decline of long-run consumer inflation uncertainty over the 1980s as a result of improved anchoring during and following the Volcker disinflation, but noted the apparent lack of improvement since the mid-90s, despite the Fed's efforts to improve its communication strategy and better anchor expectations. With an extra year of data, it looks like long-run inflation uncertainty may have actually declined, if only slightly, in the last few years. Still, that doesn't mean that consumers' expectations are strongly anchored, as I show in another working paper (which Kumar et al. follow up for New Zealand with similar results).


Monday, September 21, 2015

Whose Expectations Augment the Phillips Curve?

My first economics journal publication is now available online in Economics Letters. This link provides free access until November 9, 2015. It is a brief piece (hence the letter format) titled "Whose Expectations Augment the Phillips Curve?" The short answer:
"The inflation expectations of high-income, college-educated, male, and working-age people play a larger role in inflation dynamics than do the expectations of other groups of consumers or of professional forecasters."
Update: The permanent link to the paper is here.

Sunday, September 6, 2015

Which Measure of Inflation Should a Central Bank Target?

"Various monetary proposals can be viewed as inflation targeting with a nonstandard price index: The gold standard uses only the price of gold, and a fixed exchange rate uses only the price of a foreign currency."
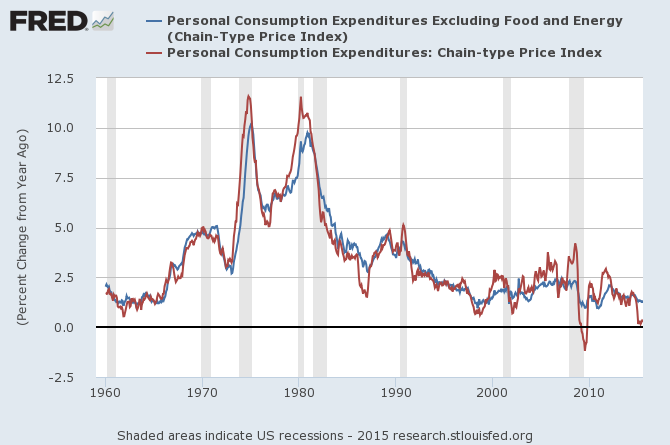
That's from a 2003 paper by Greg Mankiw and Ricardo Reis called "What Measure of Inflation Should a Central Bank Target?" At the time, the Federal Reserve had not explicitly announced its inflation target, though an emphasis on core inflation, which excludes volatile food and energy prices (the blue line in the figure below), arose under Alan Greenspan's chairmanship. Other central banks, including the Bank of England and the European Central Bank, instead focus on headline inflation. In 2012, the Fed formalized PCE inflation as its price stability target, but closely monitors core inflation as a key indicator of underlying inflation trends.. Some at the Fed, including St. Louis Fed President James Bullard, have argued that the Fed should focus more on headline inflation (the red line) and less on core inflation (the blue line).

Source: FRED
Mankiw and Reis frame the issue more generally than just a choice between core and headline inflation. A price index assigns weights to prices in each sector of the economy. A core price index would put zero weight on food and energy prices, for example, but you could also construct a price index that put a weight of 0.75 on hamburgers and 0.25 on milkshakes, if that struck your fancy. Mankiw and Reis ask how a central bank can optimally choose these weights for the price index it will target in order to maximize some objective.

In particular, they suppose the central bank's objective is to minimize the volatility of the output gap. They explain, "We are interested in finding the price index that, if kept on an assigned target, would lead to the greatest stability in economic activity. This concept might be called the stability price index." They model how the weight on each sector in this stability price index depend on certain sectoral properties: the cyclical sensitivity of the sector, the proclivity of the sector to experience idiosyncratic shocks, and the speed with which the prices in the sector can adjust.

The findings are mostly intuitive. If a particular sector's prices are very procyclical, do not experience large idiosyncratic shocks, or are very sticky, that sector should receive relatively large weight in the stability price index. Each of these characteristics makes the sector more useful from a signal-extraction perspective as an indicator of economic activity.

Next, Mankiw and Reis do a "back-of-the-envelop" exercise to calculate the weights for a stability price index for the United States using data from 1957 to 2001. They consider four sectors: food, energy, other goods and services, and nominal wages. They stick to four sectors for simplicity, but it would also be possible to include other prices, like gold and other asset prices. To the extent that these are relatively flexible and volatile, they would probably receive little weight.  The inclusion of nominal wages is interesting, because it is a price of labor, not of a consumption good, so it gets a weight of 0 in the consumer price index. But nominal wages are procyclical, not prone to indiosyncratic shocks, and sticky, so the result is that the stability price index weight on nominal wages is near one, while the other sectors get weights near zero. This finding is in line with other results, even derived from very different models, about the optimality of including nominal wages in the monetary policy target.

More recently, Josh Bivens and others have proposed nominal wage targets for monetary policy, but they frame this as an alternative to unemployment as an indicator of labor market slack for the full employment component of the Fed's mandate. In Mankiw and Reis' paper, even a strict inflation targeting central bank with no full employment goal may want to use nominal wages as a big part of its preferred measure of inflation. (Since productivity

If we leave nominal wages out of the picture, the results provide some justification for a focus on core, rather than headline, inflation. Namely, food and energy prices are very volatile and not very sticky. Note, however, that the paper assumes that the central bank has perfect credibility, and can thus achieve whatever inflation target it commits to. In Bullard's argument against a focus on core inflation, he implicitly challenges this assumption:
"One immediate benefit of dropping the emphasis on core inflation would be to reconnect the Fed with households and businesses who know price changes when they see them. With trips to the gas station and the grocery store being some of the most frequent shopping experiences for many Americans, it is hardly helpful for Fed credibility to appear to exclude all those prices from consideration in the formation of monetary policy."
Bullard's concern is that since food and energy prices are so visible and salient for consumers, they might play an oversized role in perceptions and expectations of inflation. If the Fed holds core inflation steady while gas prices and headline inflation rise, maybe inflation expectations will rise a lot, becoming unanchored, and causing feedback into core inflation. There is mixed evidence on whether this is a real concern in recent years. I'm doing some work on this topic myself, and hope to share results soon.

As an aside to my students in Senior Research Seminar, I highly recommend the Mankiw and Reis paper as an example of how to write well, especially if you plan to do a theoretical thesis.

Note: The description of the Federal Reserve's inflation target in the first paragraph of this post was edited for accuracy on September 25.

Monday, January 12, 2015

Targeting from Below

Inflation targeting (IT) was widely adopted by central banks in both industrialized and emerging-market countries in the 1990s and 2000s. Typically, the objective for switching to an IT framework has been to reduce and stabilize high and volatile inflation. Studies of IT find that it has been successful in regards to this objective.

But how does IT fare when inflation is instead too low? Michael Ehrmann of the Bank of Canada addresses this question in "Targeting Inflation from Below: How do Inflation Expectations Behave?" He notes that the Bank of Japan adopted IT in an environment of undesirably-low inflation. Likewise, when the Federal Reserve announced a 2% inflation target in 2012, core inflation had been below 2% for some time. "Although designed to lower inflation and inflation expectations," Ehrmann writes, "IT is now charged with the objective to raise them, a challenge that has not yet been studied extensively."

Since inflation targeting is supposed to work by anchoring expectations near the target, Ehrmann studies the inflation expectations of professional forecasters to compare the performance of IT when inflation is persistently low, near target, and persistently high. He uses data from Consensus Economics for Australia, Canada, the euro area, France, Germany, Italy, Japan, the Netherlands, New Zealand, Norway, Spain, Sweden, Switzerland, the United Kingdom and the United States. He uses three different indicators of the extent to which inflation expectations are anchored: (1) the extent to which expectations depend on lagged inflation; (2) forecaster disagreement; and (3) the extent to which inflation expectations get revised in response to news. On all three counts, he finds that under persistently low inflation, expectations can become disanchored. That is, inflation expectations are more dependent on lagged inflation; forecasters disagree more; and inflation expectations get revised down in response to lower-than-expected inflation. He also finds that when inflation is persistently low, expectations do not get revised upward in response to higher-than-expected inflation.

These findings are important. We tend to worry about inflation expectations becoming disanchored when inflation goes too high above target or stays above target for too long. This is partly why the inflation target gets treated more like a ceiling than a symmetric target. But in the current situation in the U.S. and Europe, it may be that keeping inflation too low is weakening the anchoring of expectations. A temporary burst of above-target inflation seems unlikely to damage the anchor.


Sunday, December 7, 2014

Most Households Expect Interest Rates to Increase by May

Two new posts on the New York Federal Reserve's Liberty Street Economics Blog describe methods of inferring interest rate expectations from interest rate futures and forwards and from surveys conducted by the Trading Desk of the New York Fed. In a post at the Atlanta Fed's macroblog, "Does Forward Guidance Reach Main Street?," economists Mike Bryan, Brent Meyer, and Nicholas Parker, ask, "But what do we know about Main Street’s perspective on the fed funds rate? Do they even have an opinion on the subject?"

To broach this question, they use a special question on the Business Inflation Expectations (BIE) Survey. A panel of businesses in the Sixth District were asked to assign probabilities that the federal funds rate at the end of 2015 would fall into various ranges. The figure below compares the business survey responses to the FOMC's June projection. The similarity between businesspeoples' expectations and FOMC members' expectations for the fed funds rate is taken as an indication that forward guidance on the funds rate has reached Main Street.


What about the rest of Main Street-- the non-business-owners? We don't know too much about forward guidance and the average household. I looked at the Michigan Survey of Consumers for some indication of households' interest rate expectations. One year ago, in December 2013, 61% of respondents on the Michigan Survey said they expected interest rates to rise in the next twelve months. Only a third of consumers expected rates to stay approximately the same. According to the most recently-available edition of the survey, from May 2014, 63% of consumers expect rates to rise by May 2015.

The figure below shows the percent of consumers expecting interest rates to increase in the next twelve months in each survey since 2008. I use vertical lines to indicate several key dates. In December 2008, the federal funds rate target was reduced to 0 to 0.25%, marking the start of the zero lower bound period. Nearly half of consumers in 2009 and 2010 expected rates to rise over the next year. In August 2011, Fed officials began using calendar-based forward guidance when they announced that they would keep rates near zero until at least mid-2013. Date-based forward guidance continued until December 2012. Over this period, less than 40% of consumers expected rate increases.

In December 2012, the Fed adopted the Evans Rule, announcing that the fed funds rate would remain near zero until the unemployment rate fell to 6.5%. In December 2013, the Fed announced a modest reduction in the pace of its asset purchases, emphasizing that this "tapering" did not indicate imminent rate increases. The share of consumers expecting rate increases made a large jump from 55% in June 2013 to 68% in July 2013, and has remained in the high-50s to mid-60s since then.


But since 1978, the percent of consumers expecting an increase in interest rates has tracked reasonably closely with the realized change in the federal funds rate over the next twelve months (fed funds rate in month t+12 minus fed funds rate in month t). In the figure below, the correlation coefficient is 0.26. As a back-of-the-envelop calculation, if we regress the change in the federal funds rate in twelve months on the percent of consumers expecting a rate increase, the regression coefficients indicate that when 63% of consumers expect a rate increase, that predicts a 25 basis points rise in rates in the next year.


This survey data does not tell us for sure that forward guidance has reached Main Street. The survey does not specifically refer to the federal funds rate, just to interest rates in general. And households could simply have noticed that rates have been low for a long time and expect them to increase, even without hearing the Fed's forward guidance.  In an average month, 51% of consumers expect rates to rise over the next year, with a standard deviation of 15%. So the values we're seeing lately are about a standard deviation above the historical average, but they have been higher historically. In the third and fourth quarters of 1994, after the Fed had already begun tightening interest rates, 75-80% of consumers expected further rate increases. At the start of 1994, however, only half of consumers anticipated the rate increases that would come.

In May 2004, the FOMC noted that accommodation could “be removed at a pace that is likely to be measured.” That month, 85% of consumers (a historical maximum) correctly expected rates to increase.