As new Michigan Survey data becomes available, I have been updating the indices and posting them here. I previously blogged about the update through November 2015. Now that a few more months of data are publicly available, I have updated the indices through June 2016. Figure 1, below, shows the updated indices. Figure 2 zooms in on more recent years and smooths with a moving average filter. You can see that short-horizon uncertainty has been falling since its historical high point in the Great Recession, and long-horizon uncertainty has been at an historical low.
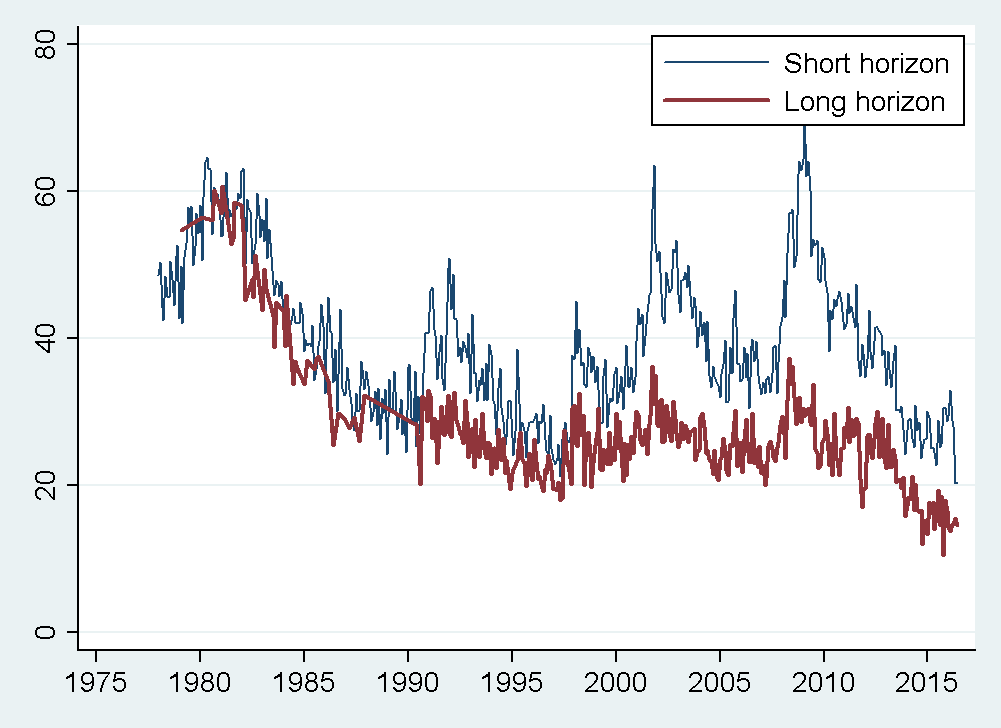 |
| Figure 1: Consumer inflation uncertainty index developed in Binder (2015) using data from the University of Michigan Survey of Consumers. To download updated data, visit https://sites.google.com/site/inflationuncertainty/. |
 |
| Figure 2: Consumer inflation uncertainty index (centered 3-month moving average) developed in Binder (2015) using data from the University of Michigan Survey of Consumers. To download updated data, visit https://sites.google.com/site/inflationuncertainty/. |
The change in response patterns from 2015 to 2016 is quite interesting. Figure 3 shows histograms of the short-horizon inflation expectation responses given in 2015 and in the first half of 2016. The brown bars show the share of respondents in 2015 who gave each response, and the black lines show the share in 2016. For both years, heaping at multiples of 5 is apparent when you observe the spikes at 5 (but not 4 or 6) and at 10 (but not 9 or 11). However, it is less sharp than in other years when the uncertainty index was higher. But also notice that in 2016, the share of 0% and 1% responses rose and the share of 2, 3, 4, 5, and 10% responses fell relative to 2015.
Some respondents take the survey twice with a 6-month gap, so we can see how people switch their responses. Of the respondents who chose a 2% forecast in the second half of 2015 (those who were possible aware of the 2% target), 18% switched to a 0% forecast and 24% switched to a 1% forecast when they took the survey again in 2016. The rise in 1% responses seems most noteworthy to me-- are people finally starting to notice slightly-below-target inflation and incorporate it into their expectations? I think it's too early to say, but worth tracking.
 |
| Figure 3: Created by Binder with data from University of Michigan Survey of Consumers |
It’s really a nice and useful piece of information. I’m glad that you shared this helpful info with us. Please keep us up to date like this. Thanks for sharing. 야동
ReplyDeleteAlso do visit may web page check this link 국산야동
This is an excellent post I seen thanks to share it. It is really what I wanted to see hope in future you will continue for sharing such a excellent post 국산야동
ReplyDeleteAlso do visit may web page check this link 한국야동
Useful blog. Good post. Everyone has something in their mind, so am I… Let’s share out thoughts and hang out sometimes.. Reach me at my site 한국야동
ReplyDeleteAlso do visit may web page check this link 야동